If you’re a blogger, there are nine metrics in Google Analytics that will help you understand how your content is performing. In this Google Analytics for Bloggers post, I show you how to monitor these nine key metrics.
But before we get started, there are two things we need to do:
- Install Google Analytics
- Exclude Your Own IP Address
How To Install Google Analytics
There are 2 easy ways of installing Google Analytics on a WordPress site.
Both methods involve downloading and installing a free WP plugin:
- either MonsterInsights
- or Insert Headers and Footers.
Full instructions on how to use either method are contained in this short video by WPBeginner on how to install Google Analytics on a WordPress site:
Exclude Your Own IP Address
A certain percentage of the activity on your blog is going to be your own, as you create and edit blog posts.
And the newer your blog, the greater that percentage will be.
Recording your own activity within Google Analytics is not going to be helpful. So the first thing you need to do is exclude your own activity from Google Analytics.
To do this, you need to create a filter in GA. Here’s how to do it:
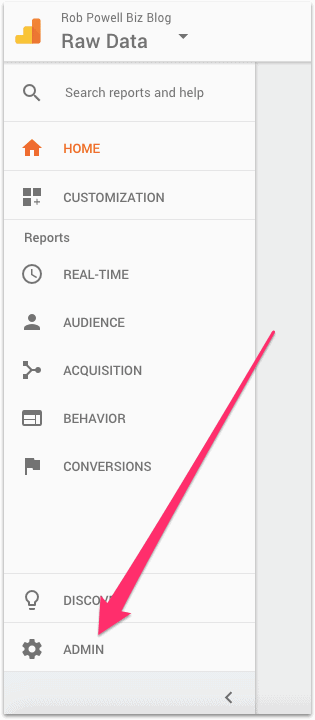
Log into your Google Analytics account and click on the Admin cog:
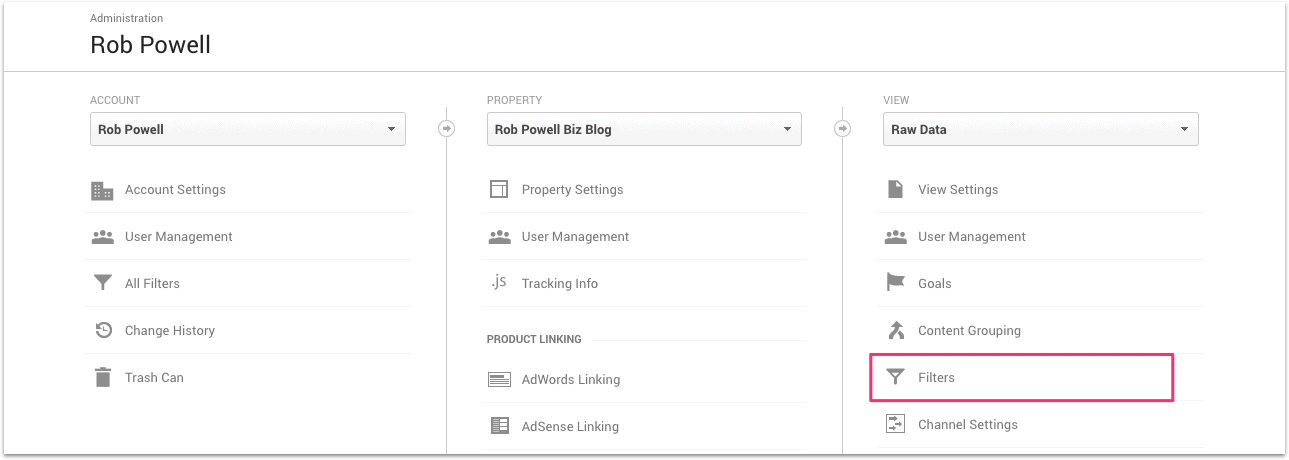
On the next screen, go to the View column and click on Filters:
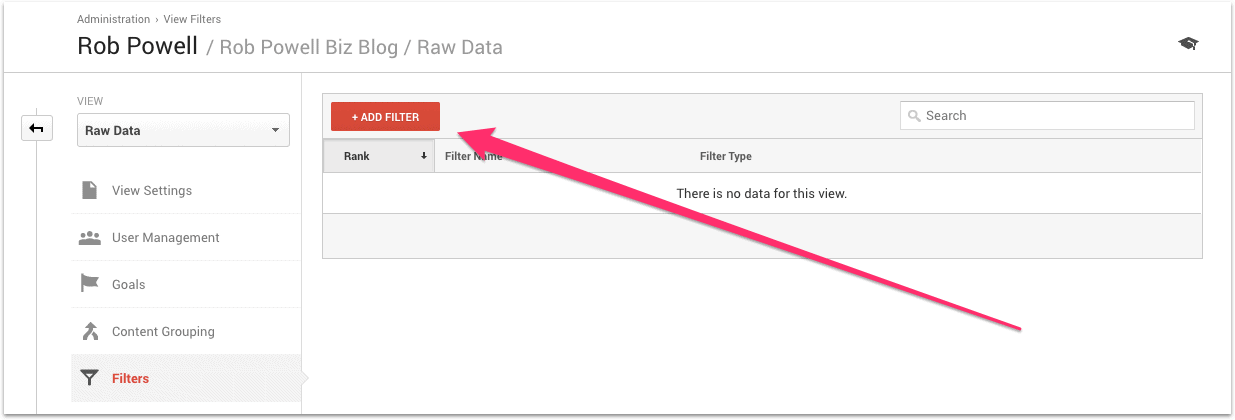
Then click Add Filter:
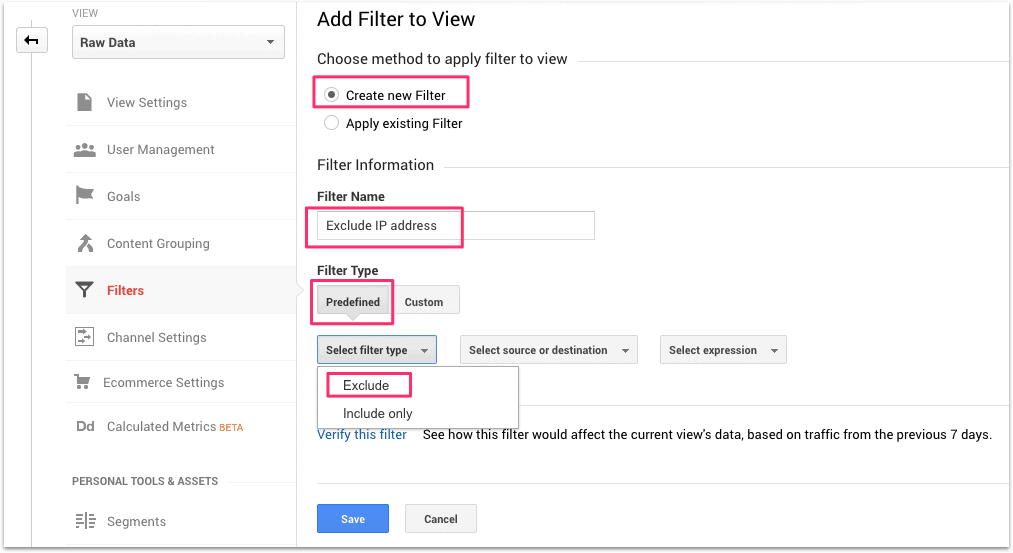
Then check the radio button for Create new Filter.
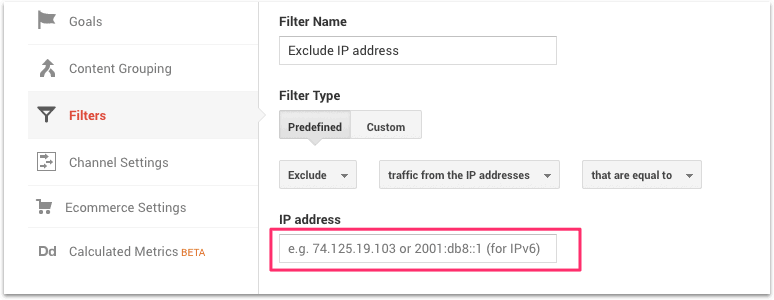
Give your filter a name (e.g. ‘Exclude IP address’)
Choose the Predefined Filter Type, and in the drop-down menu choose Exclude:
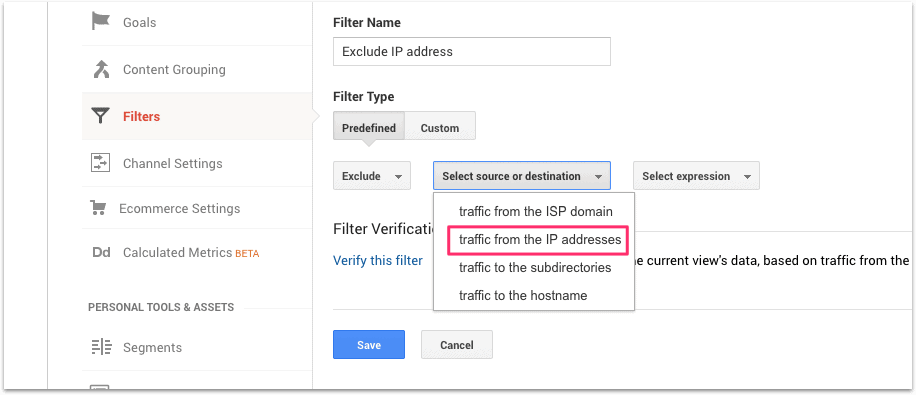
In the Select source or destination dropdown, choose traffic from the IP addresses:
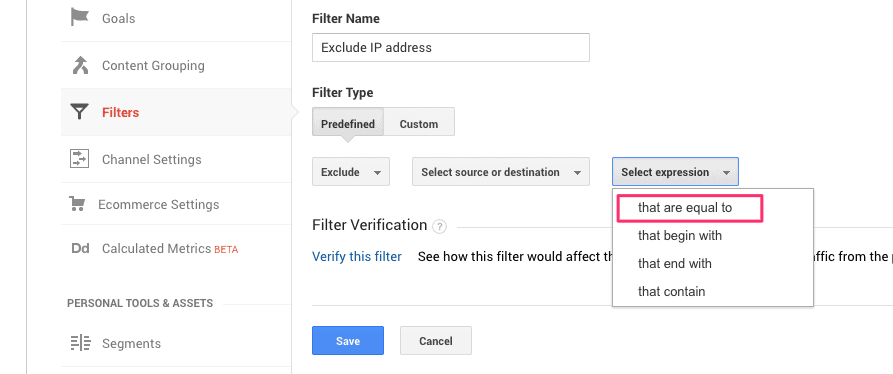
In the Select expression dropdown, choose that are equal to:
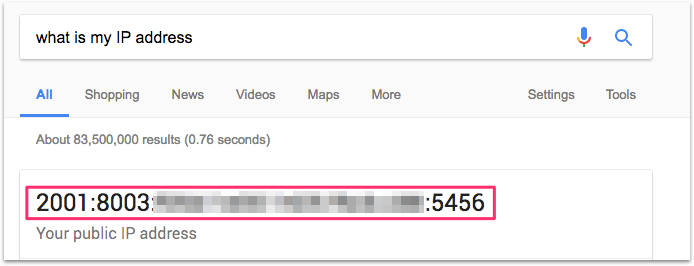
Now go to Google Search and type in “What is my IP address”:
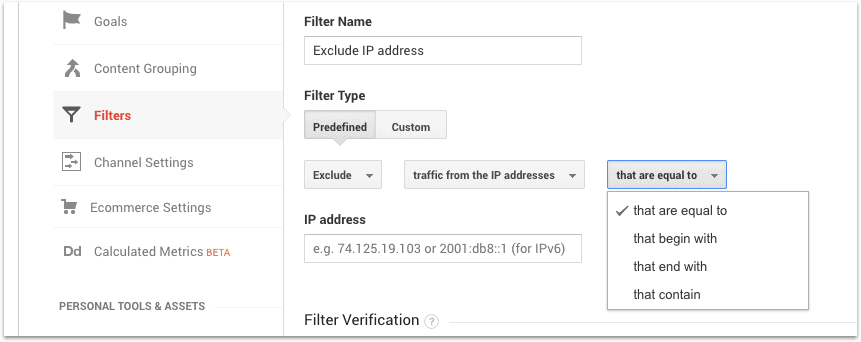
Copy your IP address and paste it into the IP address field and click Save:
On the next screen you’ll see your new filter:
To check that the filter is working, go to Real Time in the left-hand navigation, and then Overview:
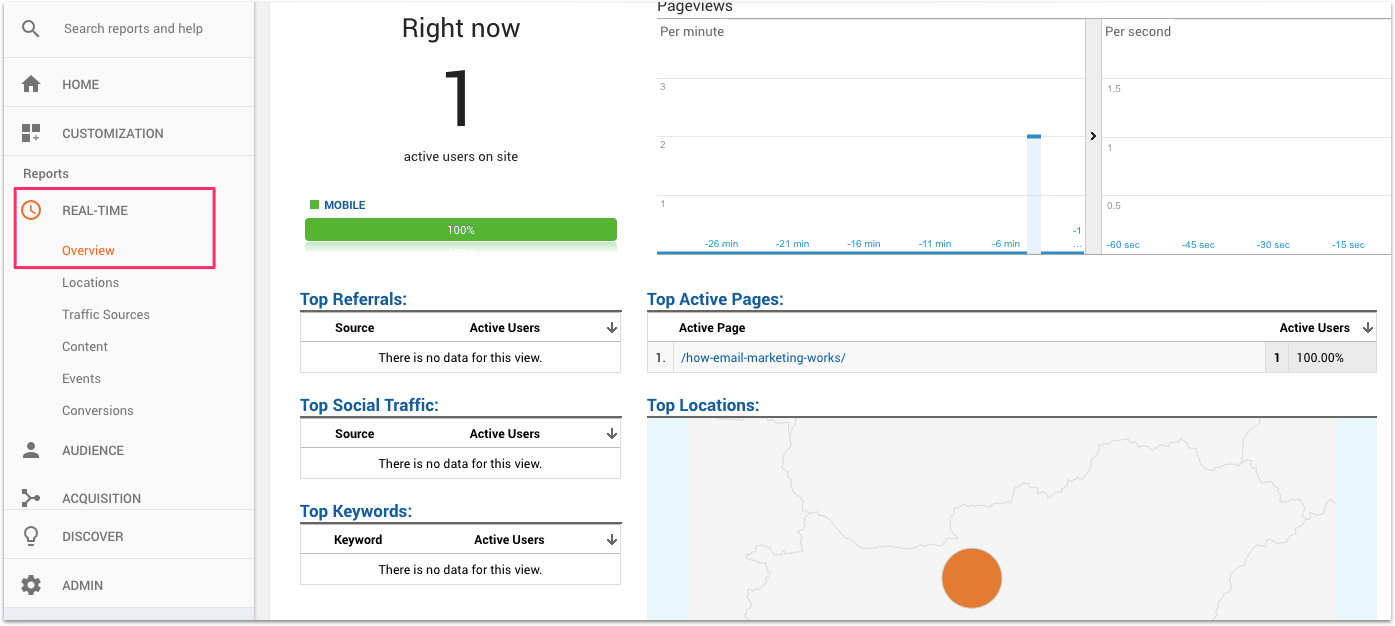
You should see local traffic from your immediate area drop off completely.
And that’s it – you now have ‘clean’ data in your Google Analytics account – GA will only be recording external visitors to your site.
9 Google Analytics Metrics For Bloggers
Google Analytics provides bloggers with a treasure trove of data-driven insights that can help them make informed decisions to optimize their blogs, enhance user experiences, and drive growth.
By harnessing the power of Google Analytics metrics, bloggers can uncover valuable information about their audience demographics, content engagement, traffic sources, and much more.
Here are the key Google analytics metrics for bloggers.
#1. Audience demographics
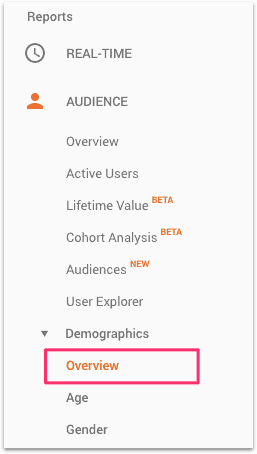
Within the Audience Section, under the Demographics Sub Section, you can see some useful information about your audience:
For example, my audience is 61.5% male and 38.5% female.
And the biggest age cohort within my audience is 25-34 yrs (40%):
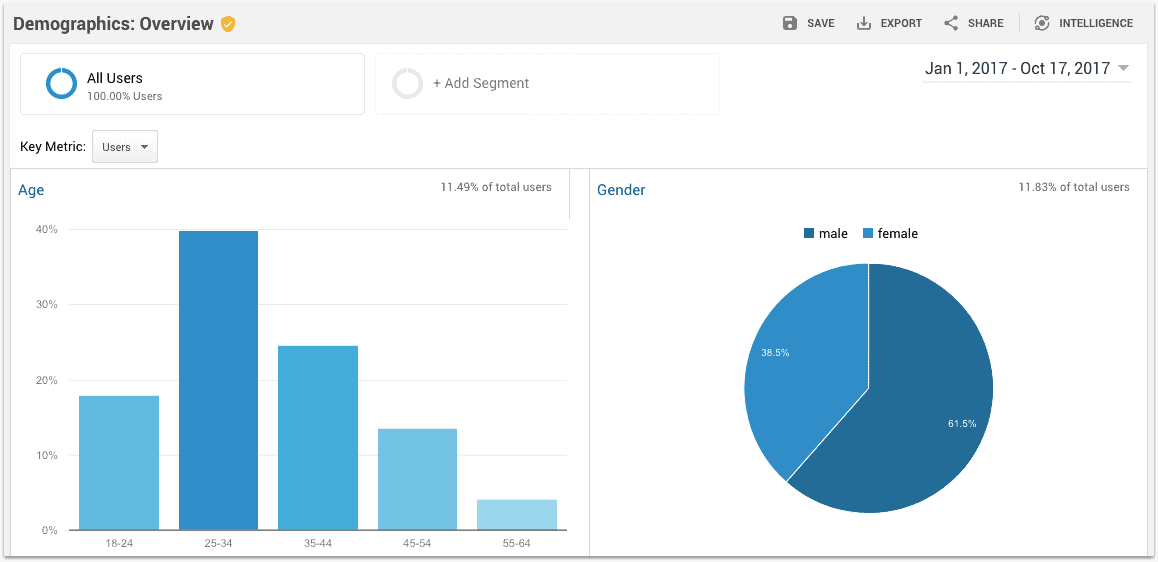
That’s valuable information for putting together your buying ‘persona’ (a semi-fictional representation of your ideal customer).
If you scroll down and click on the ‘Interests’ sub-section you get even more information:
- your audience’s Affinity Category
- your audience’s In-Market Segment
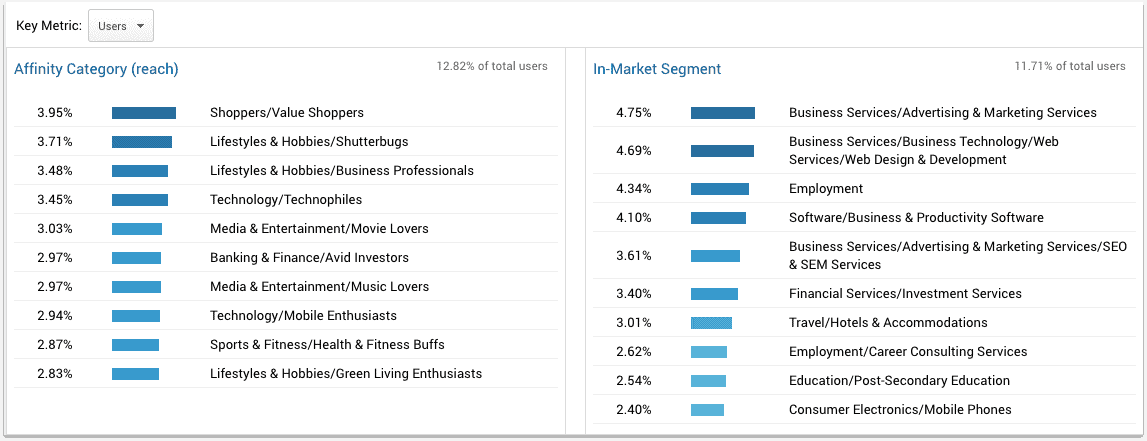
Again, this is valuable information if you’re trying to understand your audience and build a persona for your typical visitor.
But there’s a catch…
You won’t be able to see this data unless you change your settings.
Here’s how to do it:
Click again on the Admin cog (bottom left of screen).
On the next screen, click on Property Settings:
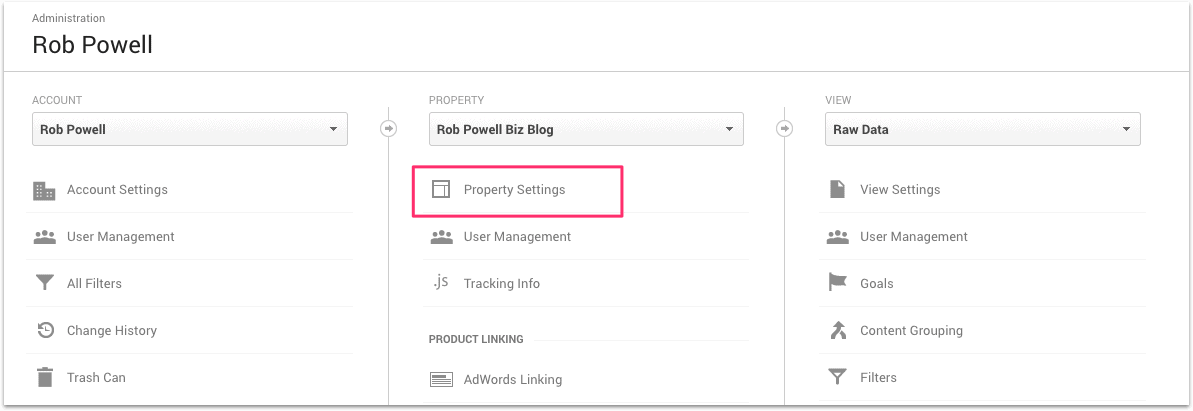
Then scroll down till you see the heading, Advertising Features:

Toggle the Enable Demographics and Interest Reports to the ‘On’ position.
That’s it – you’ll now be able to see demographics about your audience.
#2. Your most engaging content
Your content with the highest engagement is the content your audience wants more of.
Produce more of that and you’re on the way to a successful blog.
Go to Behavior > Site Content > All Pages:
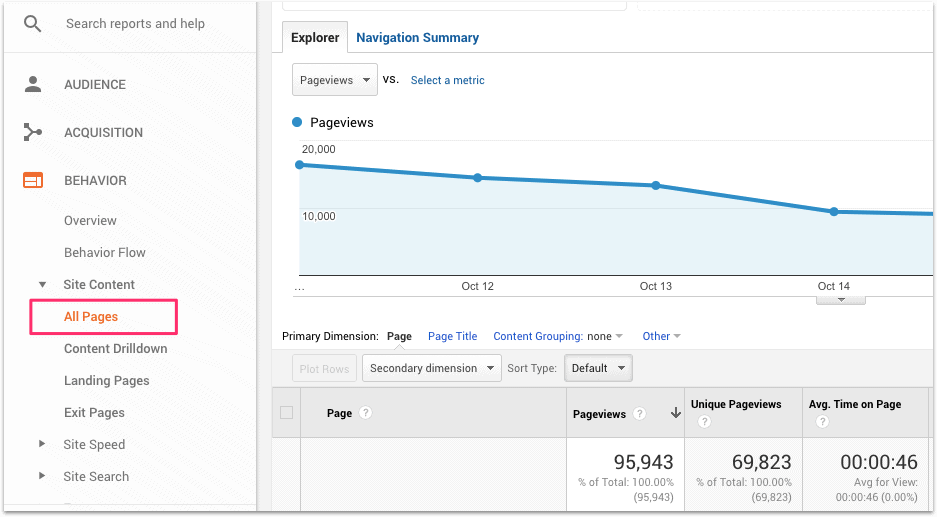
This is where you can see important blogging metrics for every piece of content on your site.
The top row on this screen shows averages for some key metrics – Average Time on Page, Average Bounce Rate, and Average Exit Rate:
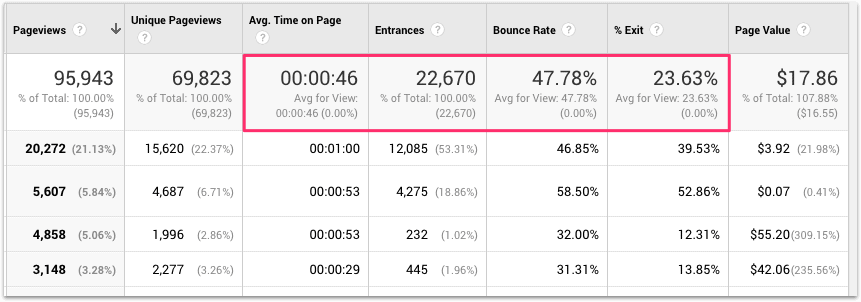
There are several ways of finding your most engaging content.
– Using Pageviews
Click within the top cell of the first column to order your content by number of pageviews, highest to lowest:
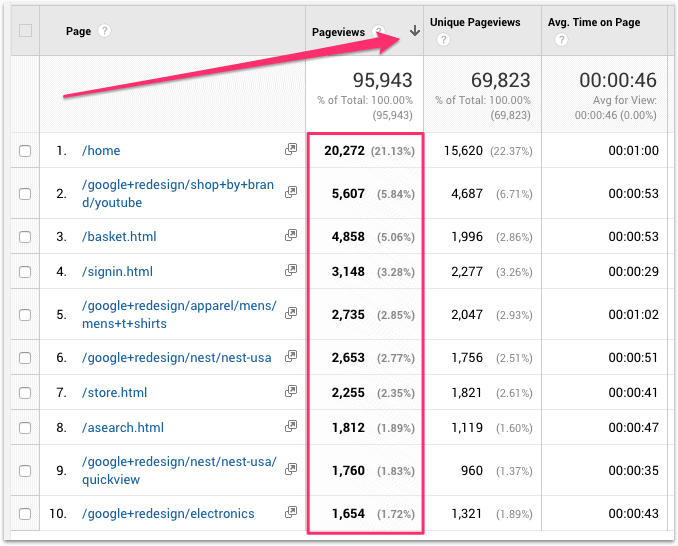
This will quickly give you an idea of what sort of content is most popular on your site.
Clearly, you’d do well to produce more of this type of content.
– Using Time On Page
Another way to find your most engaging content is to sort by time on page, also known as ‘dwell time’.
Click within the top cell in the third column to order your content by Average Time on Page, highest to lowest:
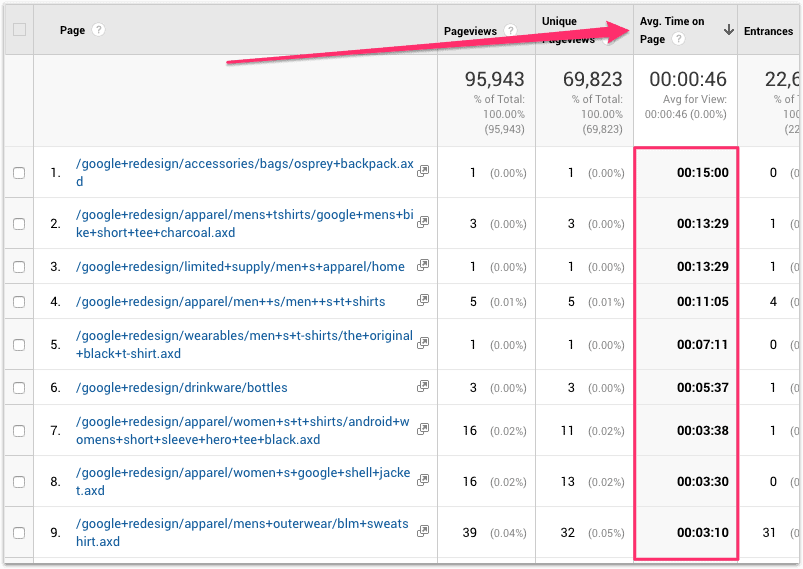
Again, this will quickly tell you what types of content on your blog are getting the most attention.
Produce more of this type of content and your reader engagement will go up.
– Using Keywords
You can also compare the performance of different types of content by using keywords.
In the example below I typed ‘electronics’ into the search box.
I can see that the average time on page for content that has the keyword ‘electronics’ in the URL is 35 secs:
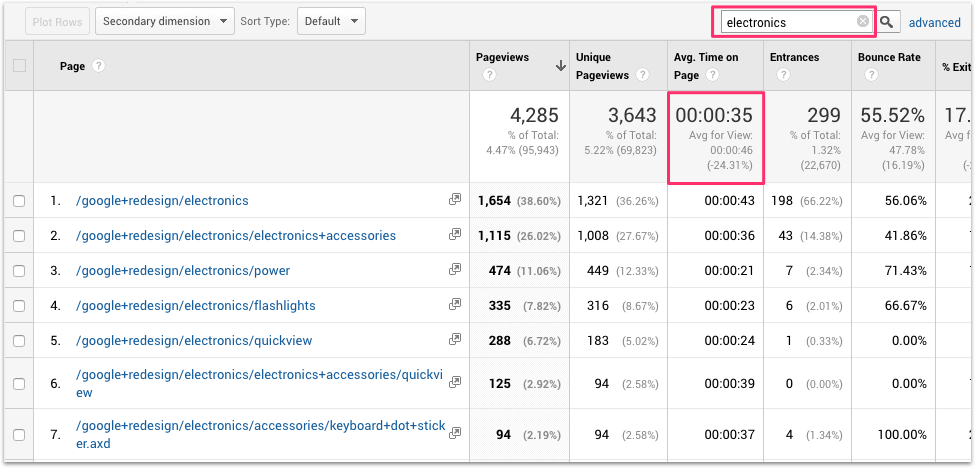
The average across all content is 46 secs, so this tells me that ‘electronics’ is a topic that my audience is less interested in.
But when I type in ‘backpacks’ I see that the average time on page for this content is a whopping 1 minute and 1 second:
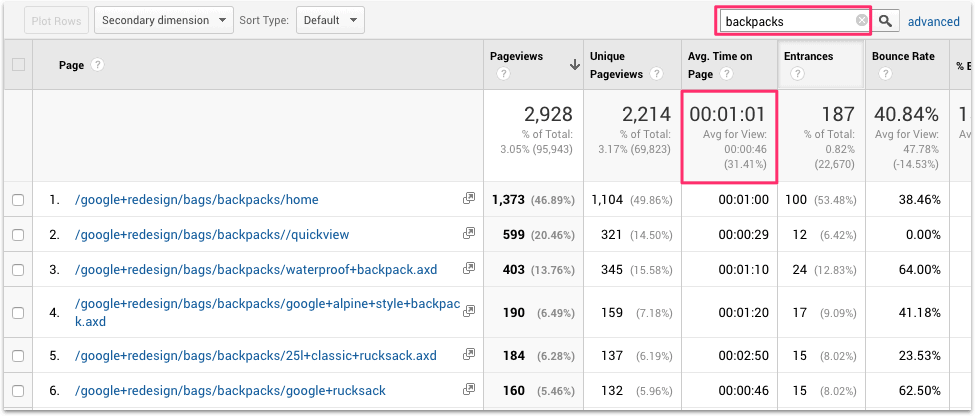
If I write more blog posts around that topic, my reader engagement is going to go up.
– Using the Comparison Chart
Another way to see which content is performing above and below average is to use the Comparison Chart.
Click on the ‘Comparison’ icon at top right:
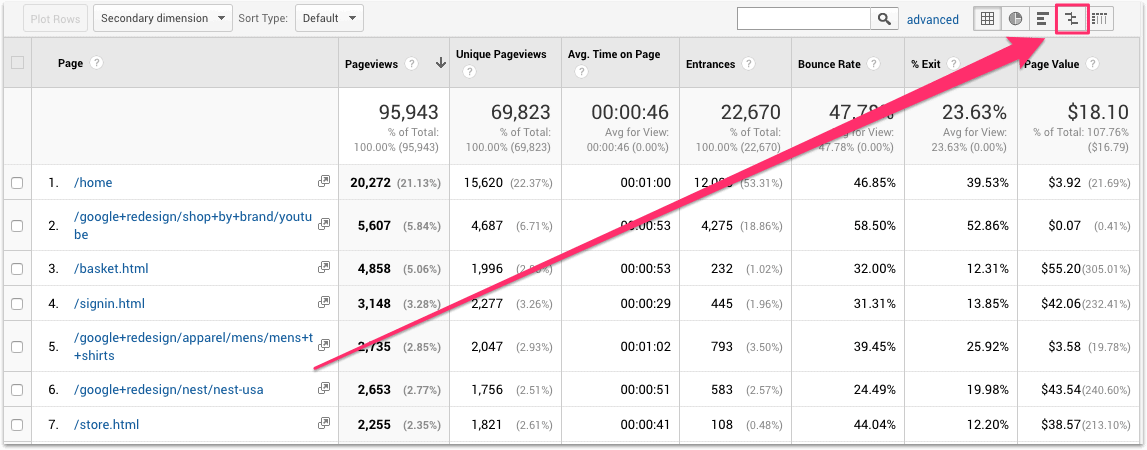
You’ll now see a comparison chart that orders your content in terms of how it compares to the sitewide average for a particular metric.
In the screenshot below I’ve chosen the metric ‘Pageviews’:
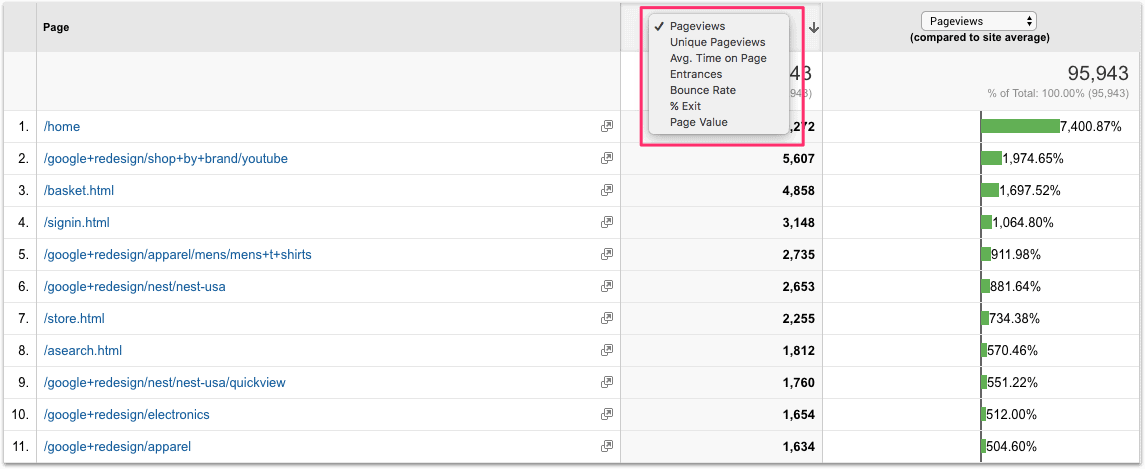
To change the metric, simply click in the dropdown at the top of the first column and choose which metric you want to see:
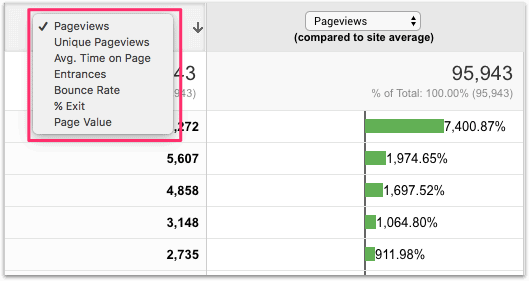
This is an easy way to see how each piece of content performs against the sitewide average for that metric:
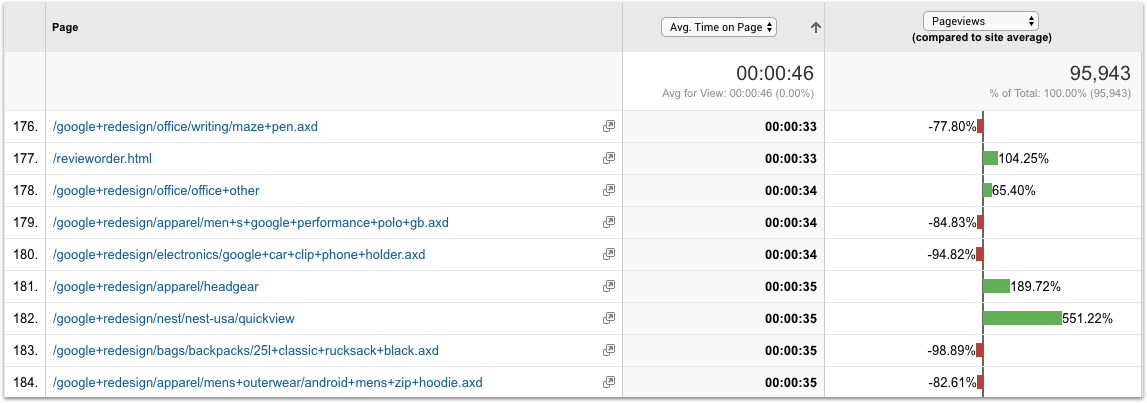
Is the particular blog post above or below average in terms of pageviews, time on page, bounce rate, exit rate etc?
And is the content on that page responsible for the page’s performance?
If so, you need to produce more of it or less of it, depending on whether the page performed above or below average.
#3. Your least engaging content
A Google analytics metric that bloggers should’t ignore is the content that gets least engagement.
Sometimes the topic you want to write about is the topic your audience is least interested in.
This is another vital insight you can get from Google Analytics.
There are two ways to find underperforming content on your blog:
– Using Bounce Rate
Bounce rate is the percentage of visitors to your website who leave your site after viewing only one page.
This can mean that your visitor came to your site, found exactly what they were looking for, and then left. That would be a good bounce event.
But more often, a bounce means the visitor landed on your page expecting something in particular, didn’t find it, and left as a result.
Pages with a high bounce rate often indicate content that doesn’t resonate with your audience.
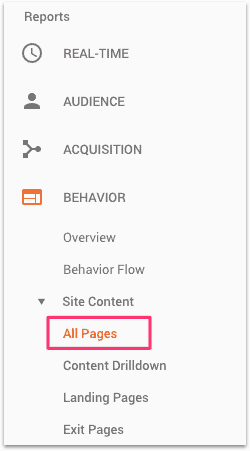
To see the bounce rate for all your blog posts go back to Behavior > Site Content > All Pages in the left-hand navigation:
Click within the top cell in the Bounce Rate column and order that column from highest to lowest:
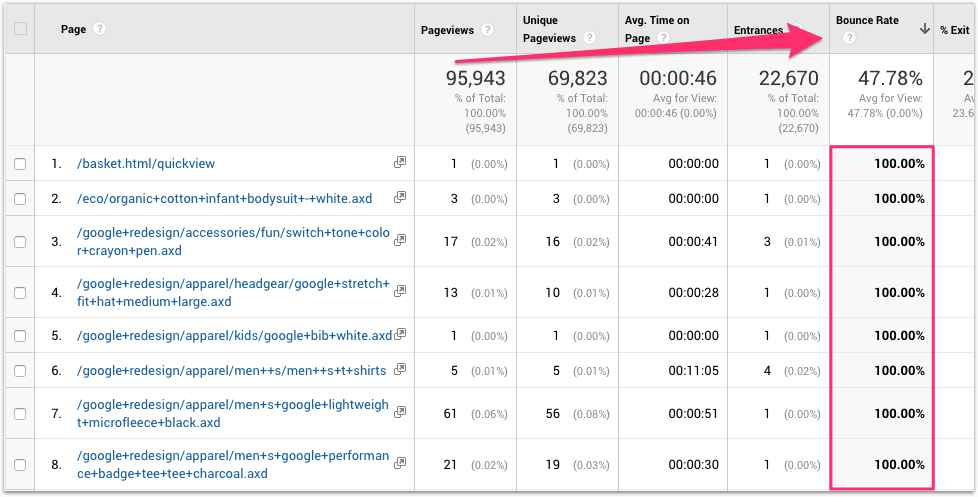
These are your pages or posts with the highest bounce rate.
Assuming that the visitor ‘bounced’ because they didn’t find what they were looking for, it’s likely that the content on these pages doesn’t resonate with your audience.
If that’s the case, then these would be topics to avoid in future.
– Using Exit Rate
Exit rate is the percentage of visitors to your website who leave on a particular page.
The difference between bounce rate and exit rate is that:
- bounce rate measures only visitors who leave a website from the same page that they arrived on.
- exit rate measures visitors who left your website from a particular page after visiting more than one page on your site.
Any page that has an above average exit rate needs to be investigated.
The exit rate column is next to the bounce rate column:
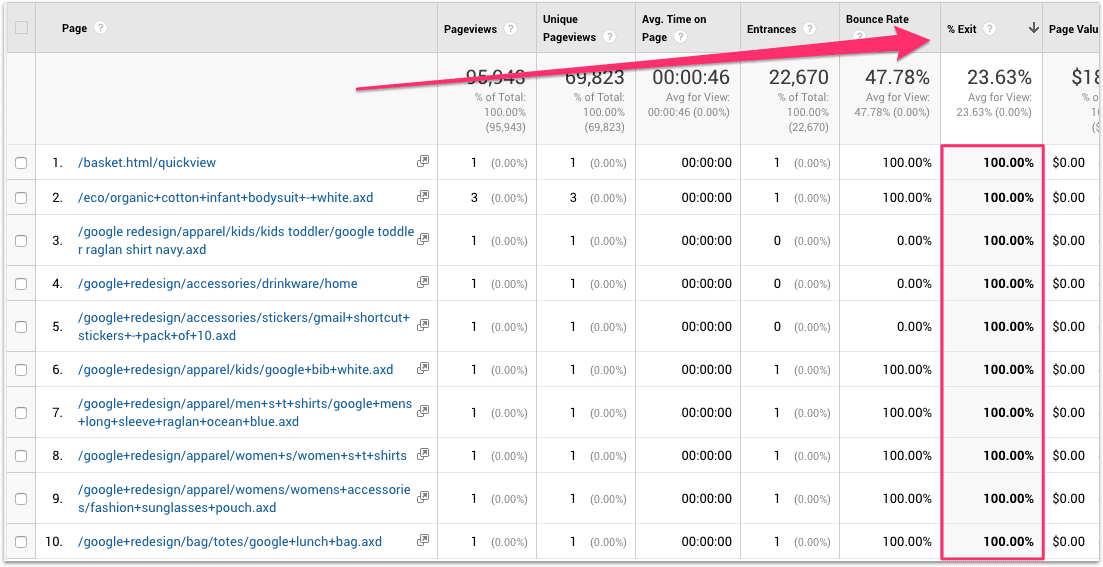
Again, you can order the column from highest to lowest by clicking within the top cell.
Try and look for patterns in these pages with above average exit rate. Are they on a particular topic, or a particular group of topics?
If so, it indicates that topic doesn’t engage your audience as well as other topics that you write about.
Again, you can use this information to decide which topics to focus on and which topics to avoid in your content strategy.
#4. Which blog posts perform best on social media?
Why would you want to know which of your blog posts do best on social media?
A couple of reasons:
- Social media is one of the most time- and cost-effective ways of promoting your blog posts
- Social media scales well (e.g. creating multiple posts for each piece of content, scheduling in bulk for months ahead, reviewing and reposting top posts)
But how do you find out which blog posts have performed best on social media?
Because if you knew that, you’d create more of that type of content.
Right?
Well, it’s easy:
In the left-hand navigation of your GA account, go to Acquisition > Social > Landing Pages:
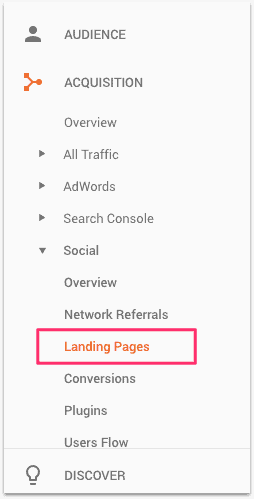
In the left column you’ll see the URL that was shared on social media.
In the right-side columns you’ll see the various metrics for how that URL performed on social media:

In the above example, I can see that my blog post on ‘tips for first year bloggers’ outperformed any other blog post, in terms of pageviews.
Obviously, you have to take into account other factors besides the topic of the content, that may have contributed to how that blog post performed.
For example, a roundup post with 91 contributing experts has far greater in-built shareability than a roundup post with just 15 contributing experts.
But in the case of my ‘tips for first year bloggers’ post, in-built shareability clearly wasn’t a factor since it had only 19 contributing experts – a roundup of 50 marketing experts (position #4) didn’t do nearly so well.
This tells me that the topic of ‘first year bloggers’ does very well on social media, for my audience.
I’d be well advised to produce more content on that topic and promote it heavily on social media.
#5. Which posts produce the most new subscribers?
Wouldn’t you love to know which of your blog posts produce the most subscribers?
Well you can!
Here’s how to do it:
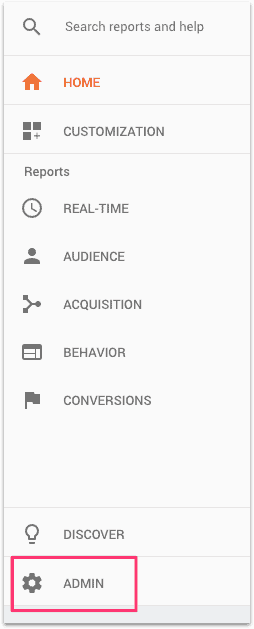
In the left-hand navigation, click on the Admin cog:
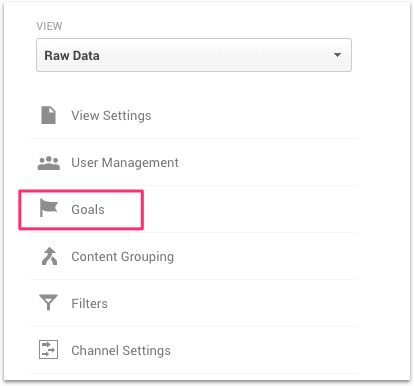
On the next screen, click on Goals in the View panel:
Now click on New Goal:

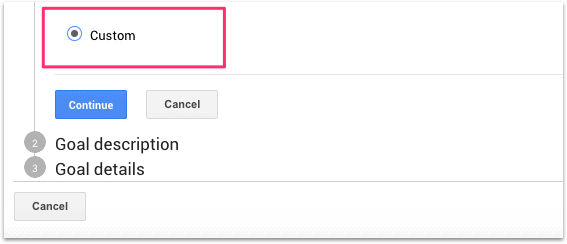
On the next screen, scroll down and check the Custom radio button, then press Continue:
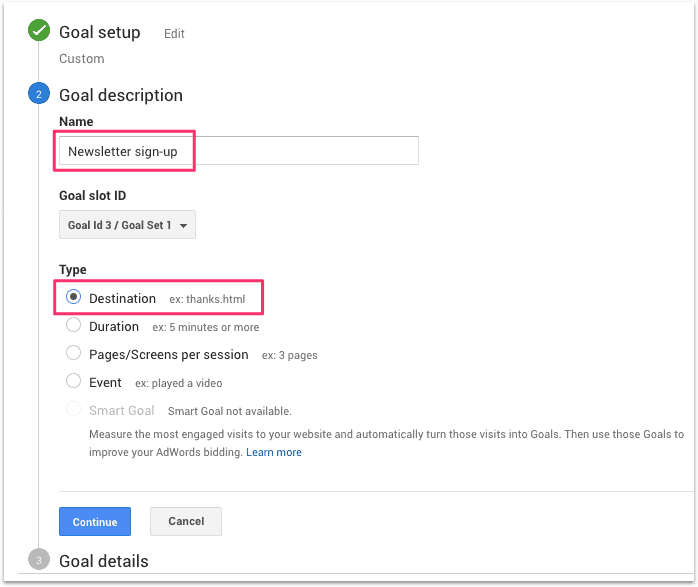
Then give your goal a name (e.g. ‘Newsletter sign-up’), check the Destination radio button, and press Continue:
On the next screen, you’ll need to specify a page that can only ever be accessed by people who have just subscribed to your newsletter or email list – for example, a ‘thank you’ page:
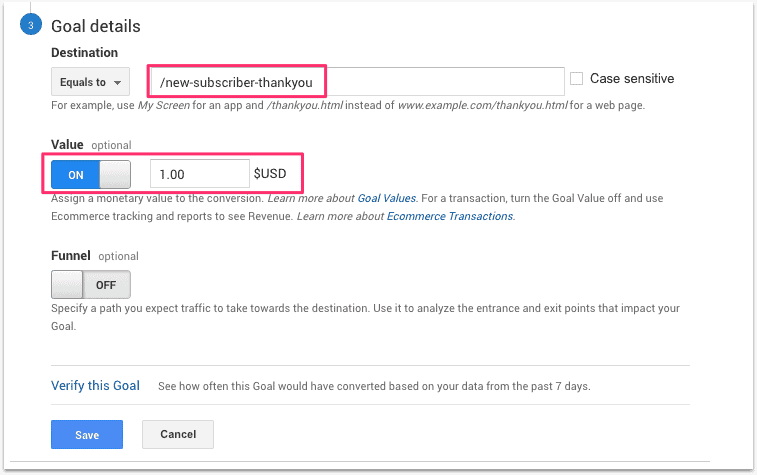
You also need to toggle the Value button to ‘On’ and enter a nominal dollar amount that represents the value of each conversion.
The dollar amount can be completely arbitrary. Even if you run a blog that is not designed to make money, you should still assign a dollar value to each goal conversion.
This article by Benjamin Mangold explains why this is so important (in a nutshell: it makes conversion tracking much easier).
Then press Save.
On the next screen, you’ll see your newly created goal:

Now, when visitors join your newsletter or optin list, you’ll be able to see which page they were on when they signed up.
And that’s very cool indeed!
Because that means you can optimize your content for newsletter sign-ups and grow your list much faster than would otherwise be the case.
Here’s how to check which blog posts or pages are producing new subscribers:
Go to Conversions > Goals > Reverse Goal Path.
In the All Goals dropdown, click on your new subscriber goal (in this case ‘Goal 1: Newsletter Signup’):
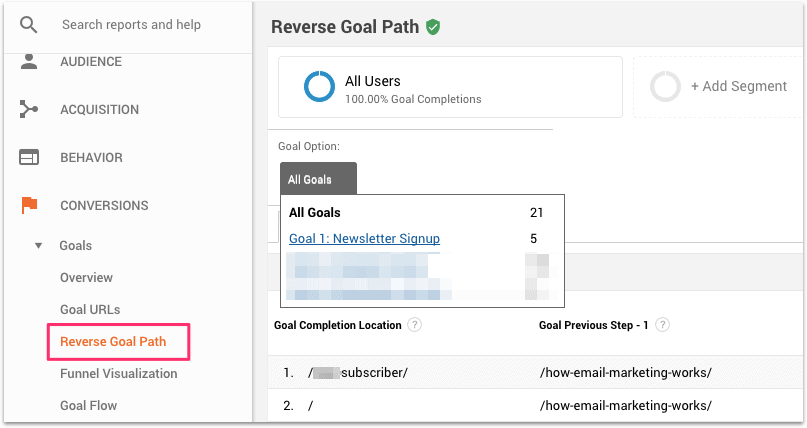
On the next screen you’ll now see the blog posts that produced new subscribers, together with the number of new subscribers attributed to each blog post:

Before you were in the dark.
But now you know exactly which content generates new subscribers – powerful information!
#6. Top Google search terms
This is another key analytics metric for bloggers. If you know the top search queries that people are using to find your content, you know what your audience wants. Just produce more of that and you’ll be on the right track.
To find the search queries that produce the most visits to your website go to Acquisition > Search Console > Queries:
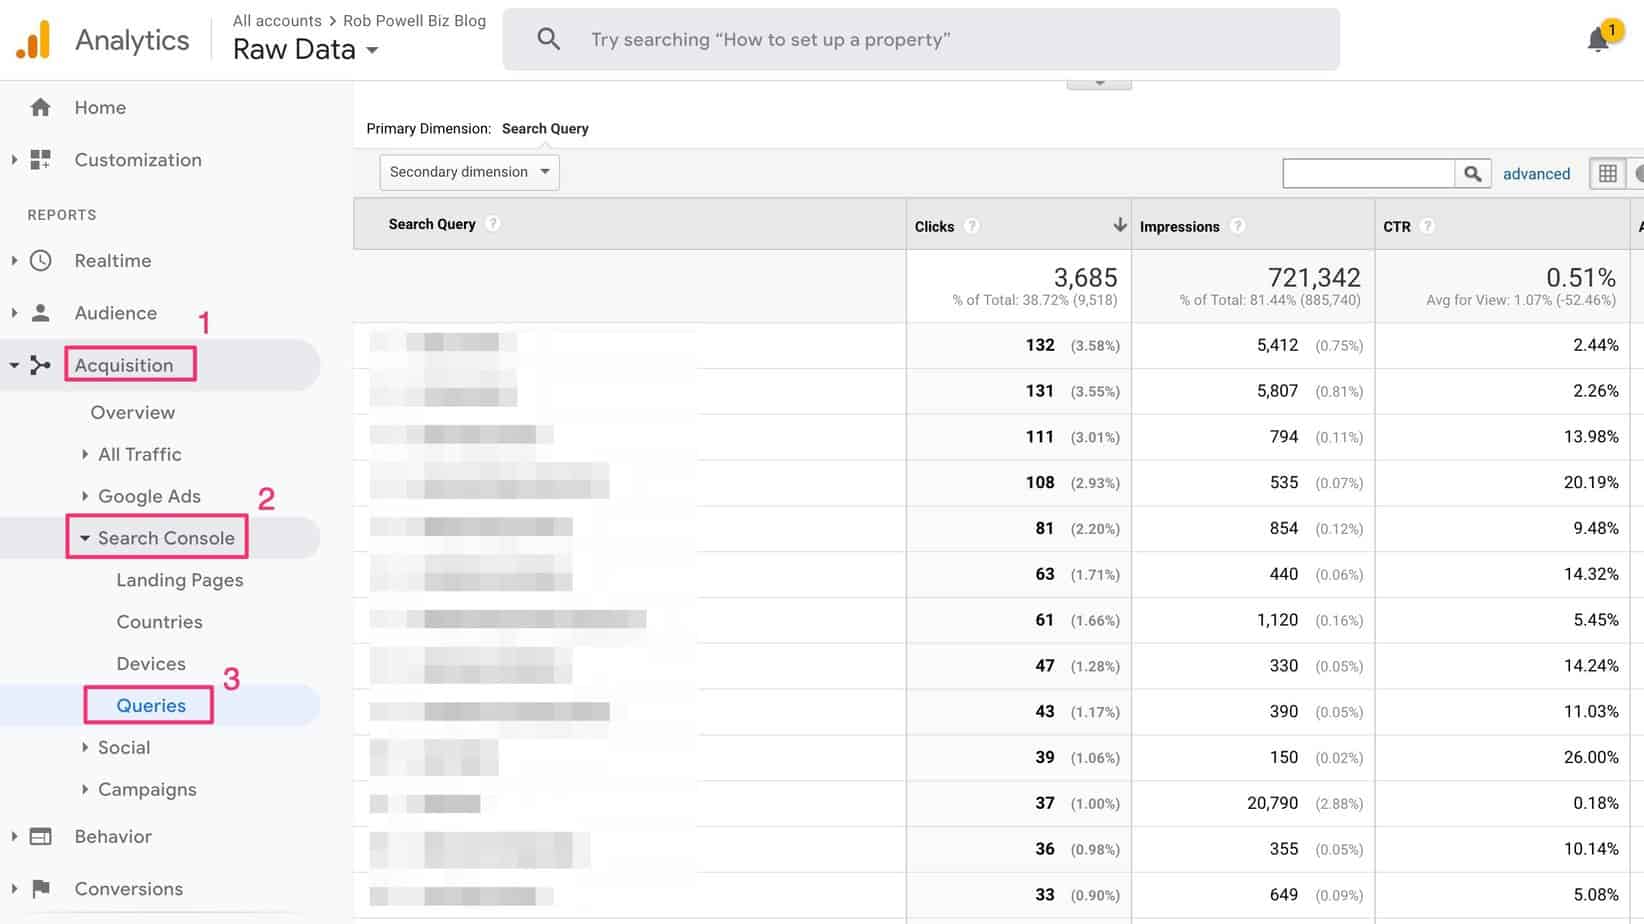
There are several ways you can use this information:
- The search queries that are producing most of your organic traffic may not be the keywords that you are targeting. If that’s the case, then you might want to examine your SEO strategy and find out why your target keywords are not generating the most traffic.
- The search queries that are producing most of your traffic show where your SEO strength lies. If you produce more content on that general topic, it’s most likely going to rank on Page #1.
- Identify areas within your niche that you are neglecting. Examining the list of search queries that generated the most traffic to your site may show you areas within your niche that you are neglecting. You might want to create more content around those sub-topics.
- Get ideas for new blog posts. One of my search queries is ‘names for lifestyle blogs’. I have a blog post titled ‘Best Blog Names – 19 Tried and Tested Formulas for Naming Your Blog’. But I could write another blog post specifically on ‘names for lifestyle blogs’.
- Understand what your audience wants. One of my search queries is ‘increase domain authority quickly’. I’ve written a blog post on how to increase domain authority, but I didn’t focus on how to get the fastest possible results.
#7. Traffic from search engines
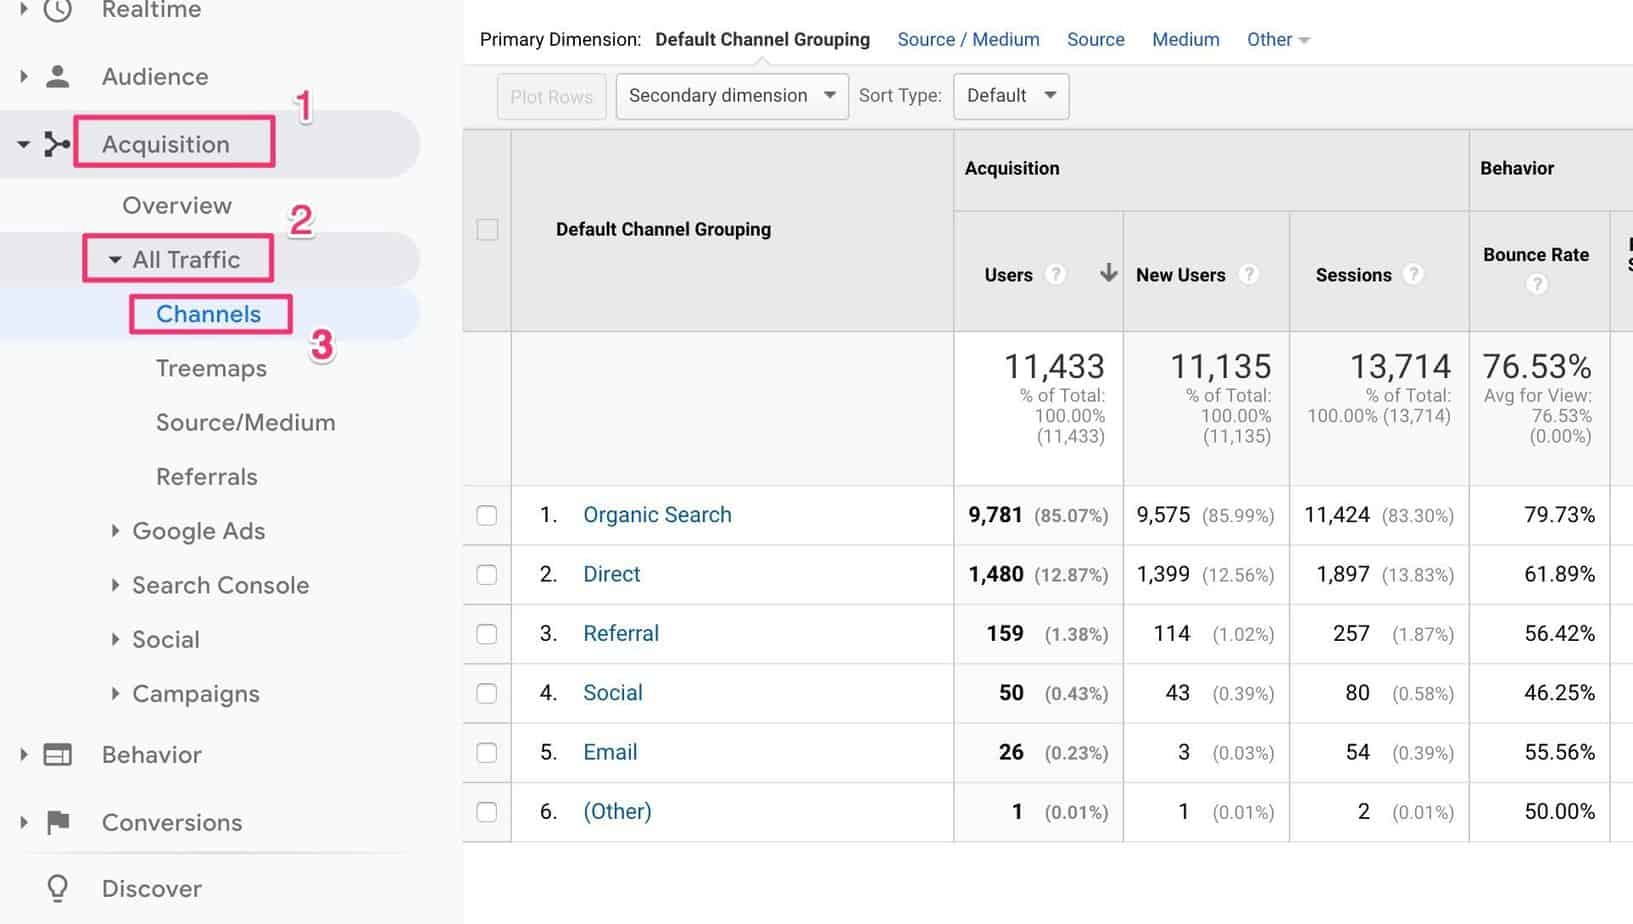
It’s useful to see what percentage of your traffic is coming from search engines. For example, if less than 50% of your traffic is coming from organic search, then you may want to spend more time and effort optimizing your content for SEO.To see what percentage of your traffic comes from the search engines, go to Acquisition > All Traffic > Channels:
#8. Traffic from individual blog posts
To see traffic generated by individual blog posts, go to Behavior > Site Content > All Pages:
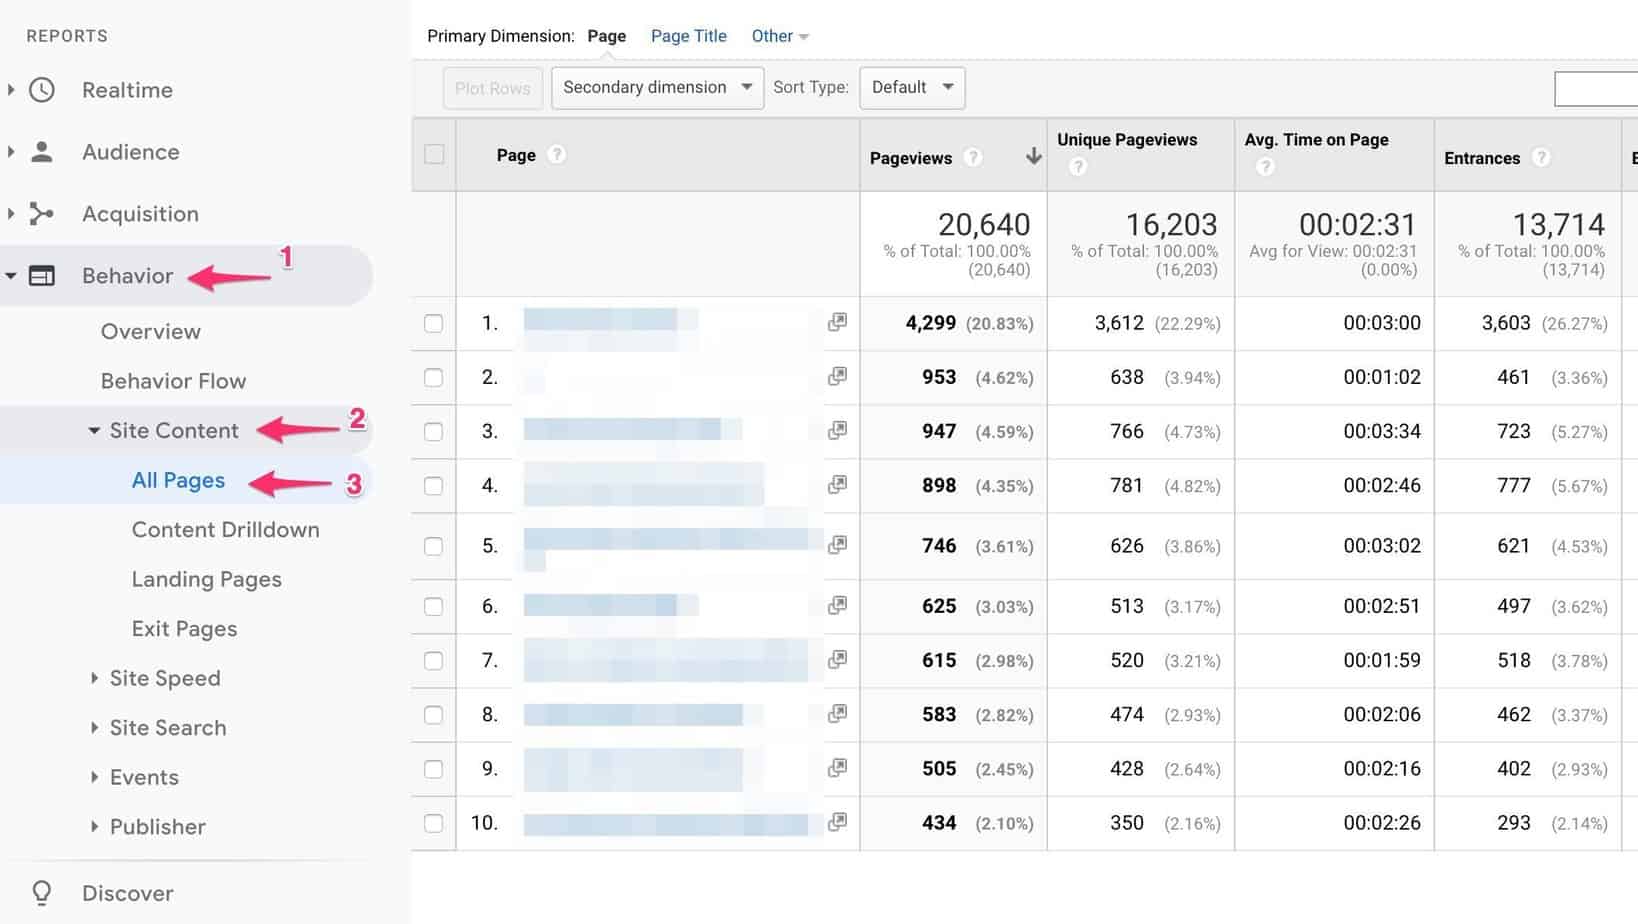
Whenever I do competitor keyword research, I’m always amazed by the fact that most websites get up to 30% of their organic traffic from a single blog post.
And you can see the same phenomenon in the screenshot above.Knowing the traffic generated by individual blog posts might be useful to you for two reasons:
- If you find that 7 of your blog posts are generating 50% of your total organic traffic, then you could focus on getting email sign-ups from those 7 pages. Instead of creating lead magnets for every single article on your website, you could create lead magnets for just those 7 blog posts.
- You may think that your audience wants articles about topic ‘x’. But 20% of your traffic may be coming from an article about topic ‘y’. You can use that information to identify what your audience really wants and change the focus of your content.
#9. New vs. returning visitors
For many websites, it’s important to know the ratio of new to returning visitors.To see this ratio for your website, go to Audience > Behavior > New vs Returning:
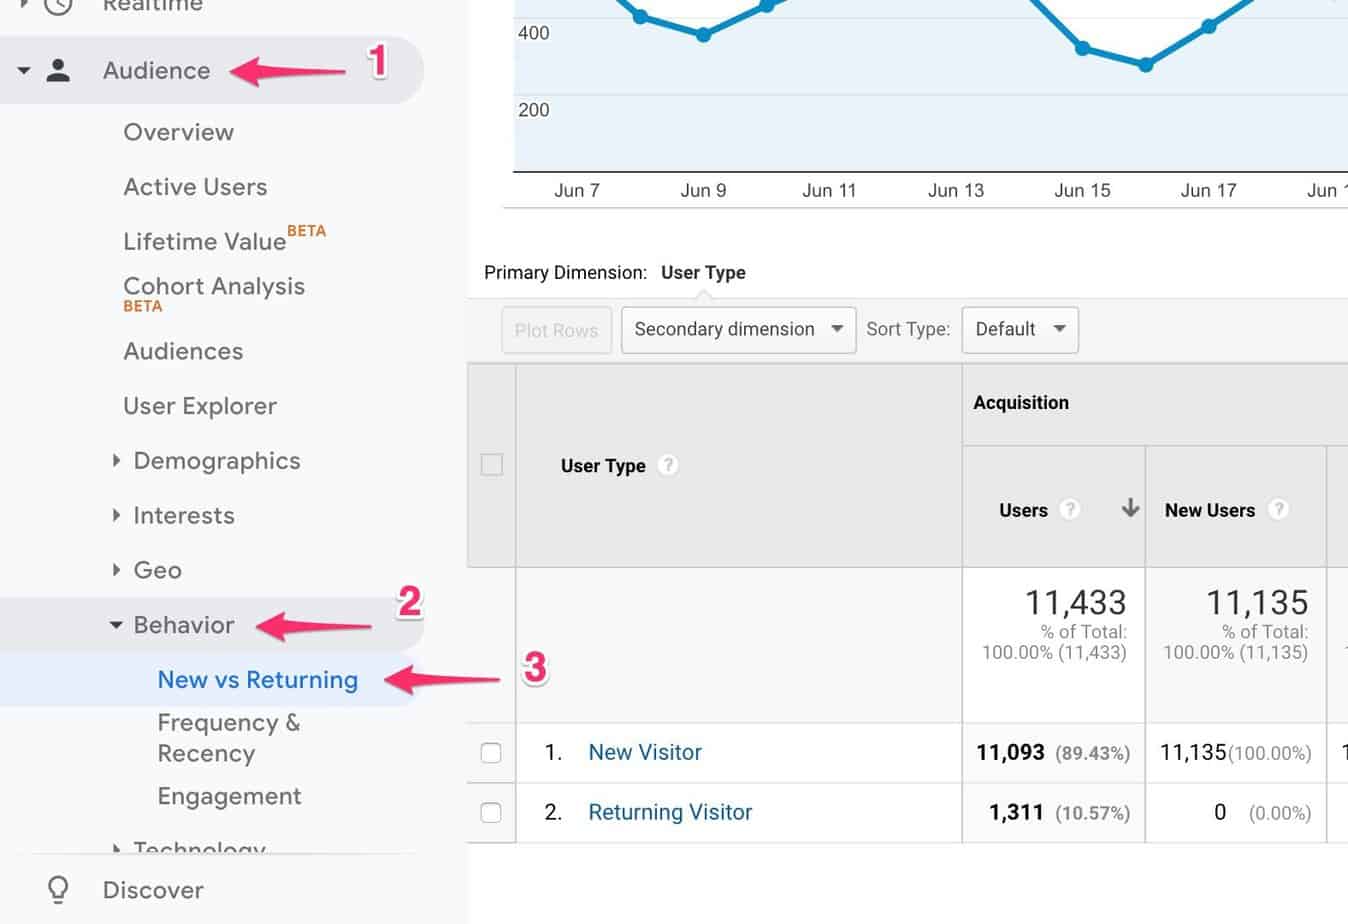
So what’s a good ratio of returning visitors to new visitors?
Thirty percent is often quoted as a good percentage for returning (as opposed to new) visitors.
But as with all metrics, the numbers by themselves don’t mean much. Why?
Because it depends where your traffic is coming from and what the purpose of your site is.
For example, if your traffic comes mainly from organic search, you would expect (and hope) that the percentage of new visitors is very high. That means that your site is constantly being exposed to a new audience. And if organic search is your main traffic source, it wouldn’t be surprising if your percentage of return visitors is quite low.
Why is that?
Because people tend to use search to solve a problem. Once the problem is solved, they have no reason to come back.
On the other hand, sites that derive most of their traffic from social media typically have a much higher percentage of returning visitors. This is because social media, unlike organic search, is all about building a following and staying in touch with your ‘tribe’.The other thing to consider is whether you want a high percentage of new visitors or a high percentage of returning visitors. If you’re trying to build your list quickly, for example, then a high percentage of new visitors is ideal.
Custom Dashboards For Bloggers
It would be useful to have all these Google analytics metrics in one place. And you can do that using ‘custom dashboards’.
Dashboards are a convenient way see all your key metrics at a glance.To create a dashboard, go to Customization > Dashboards > Create:
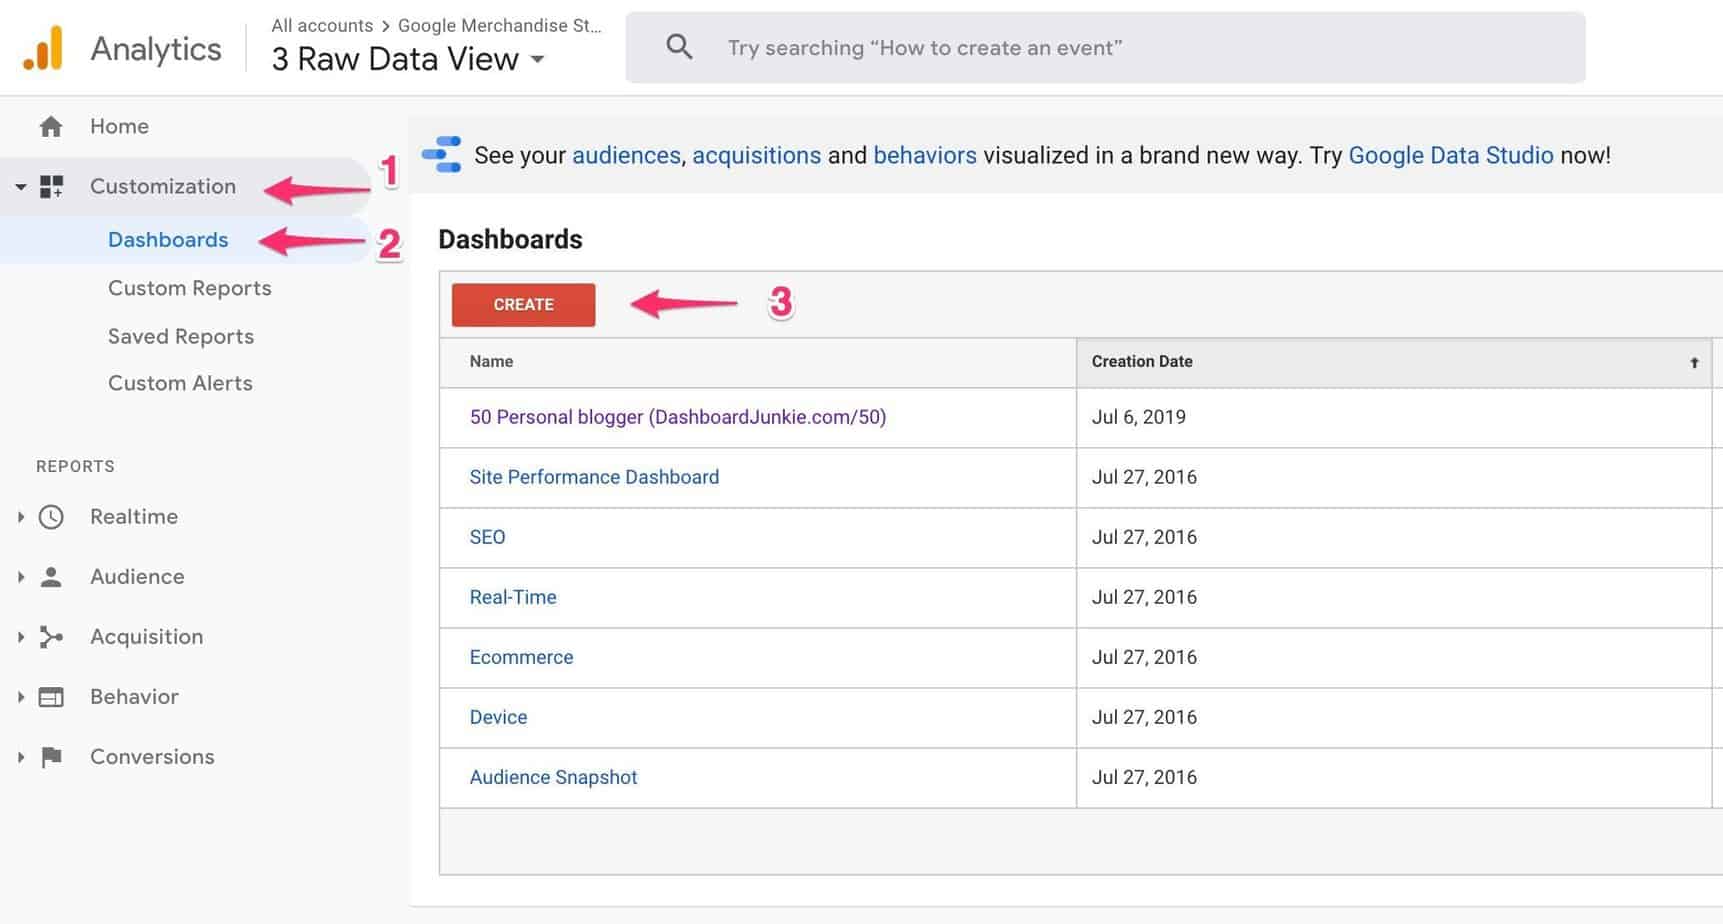
Google offers a library of ready-made dashboards. To import one of these, click the ‘Create button:
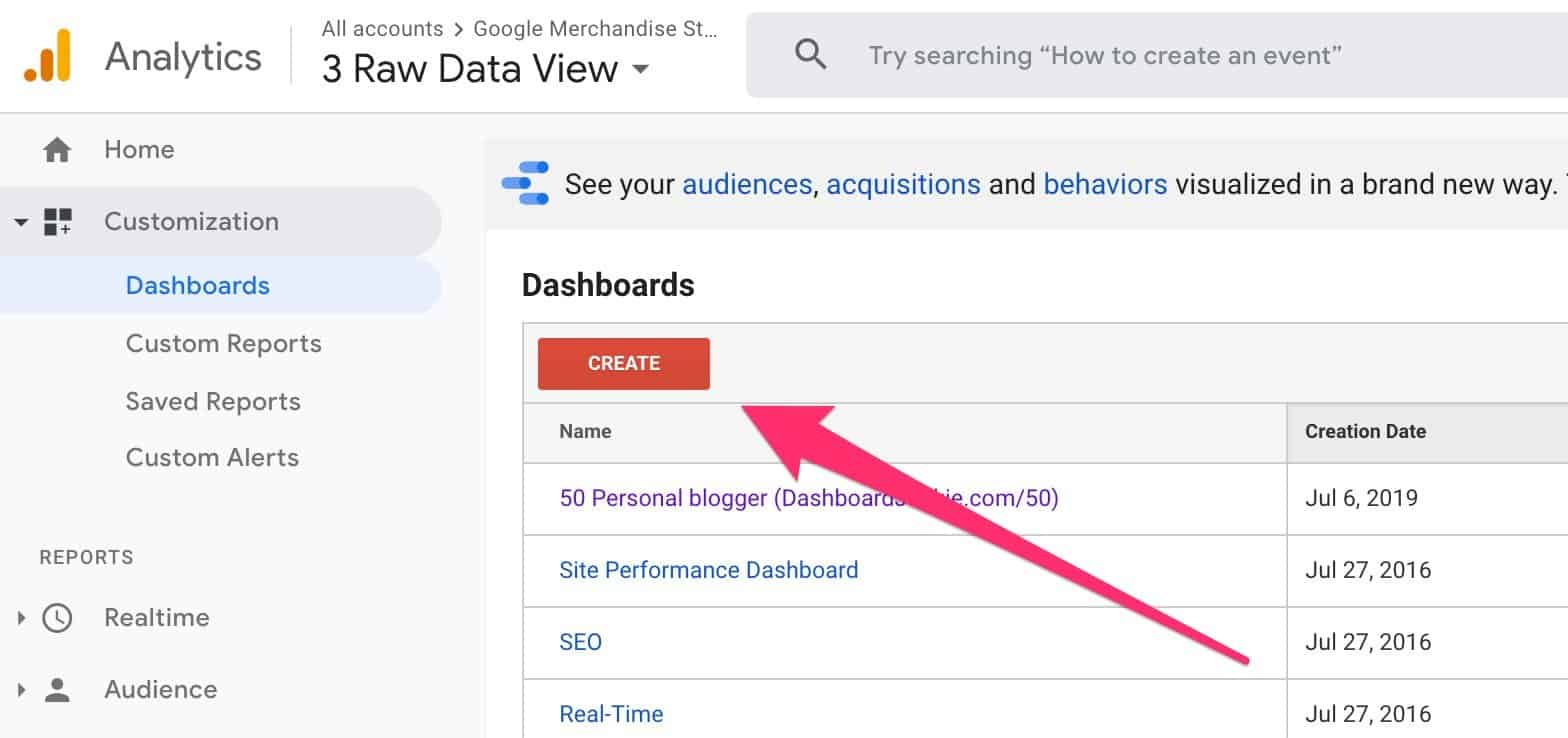
Next, click ‘Import from Gallery’:
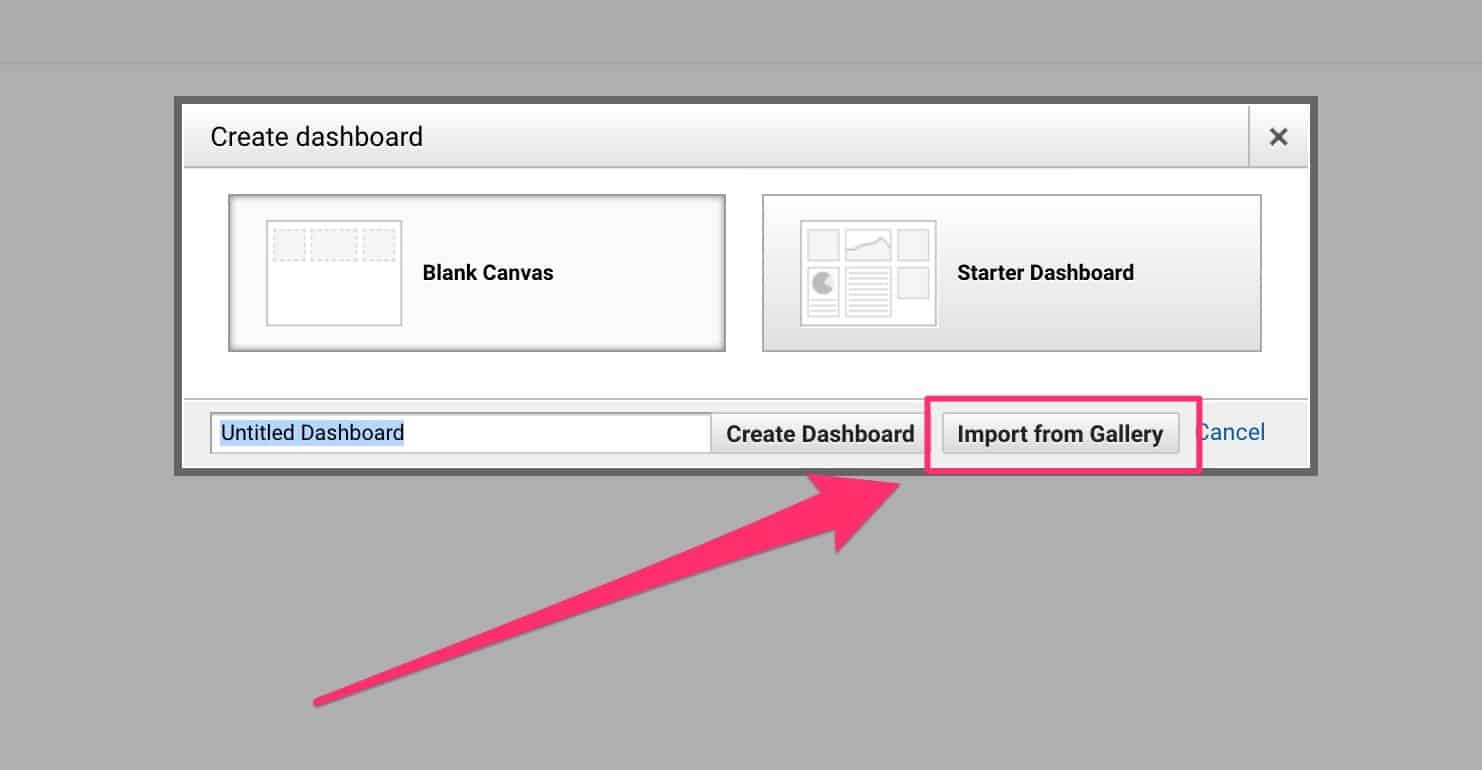
Then click ‘Go to gallery’:

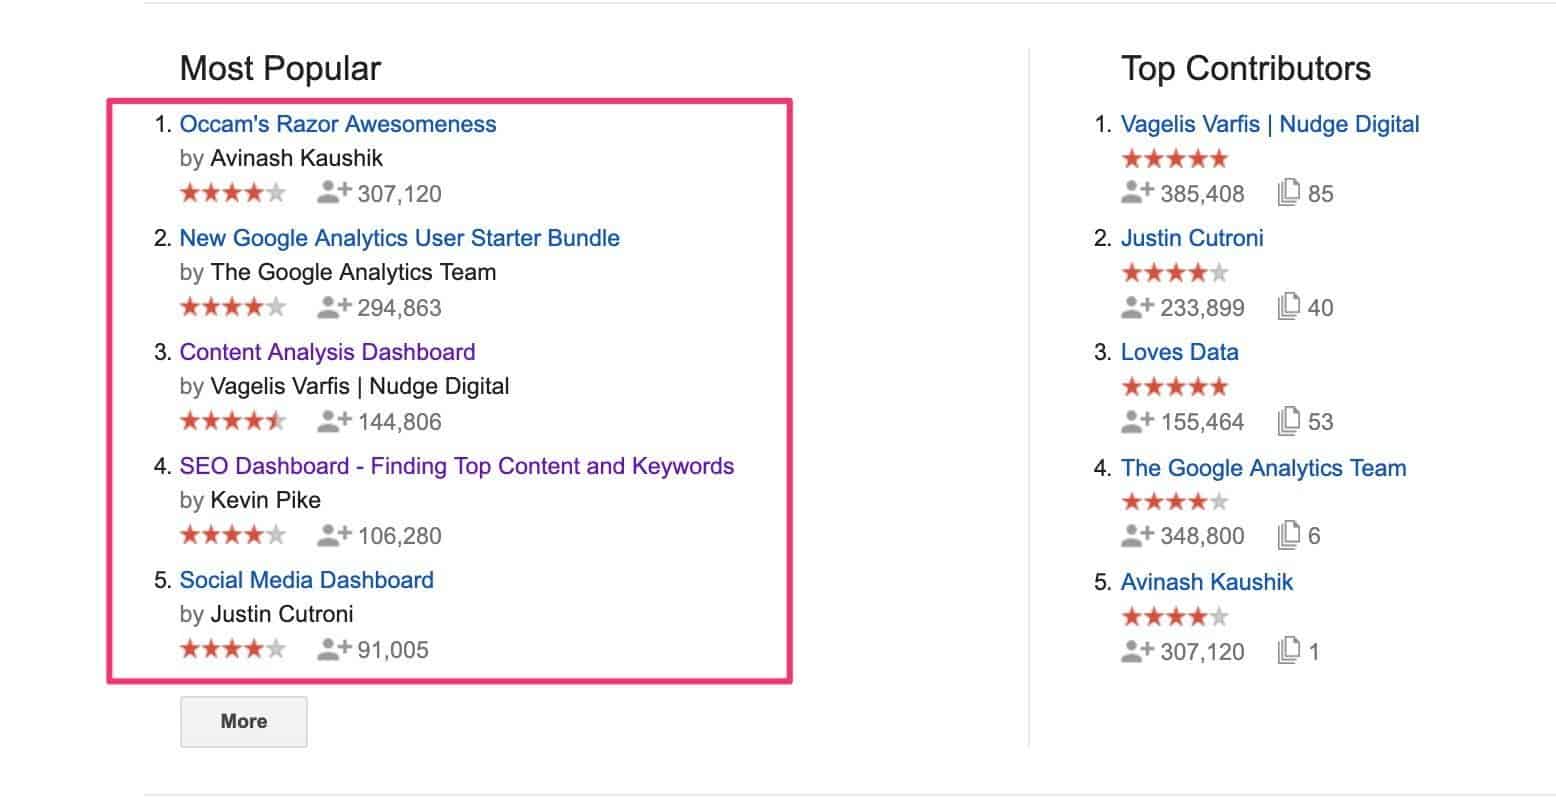
On the next screen, choose one of the ready-made dashboards:
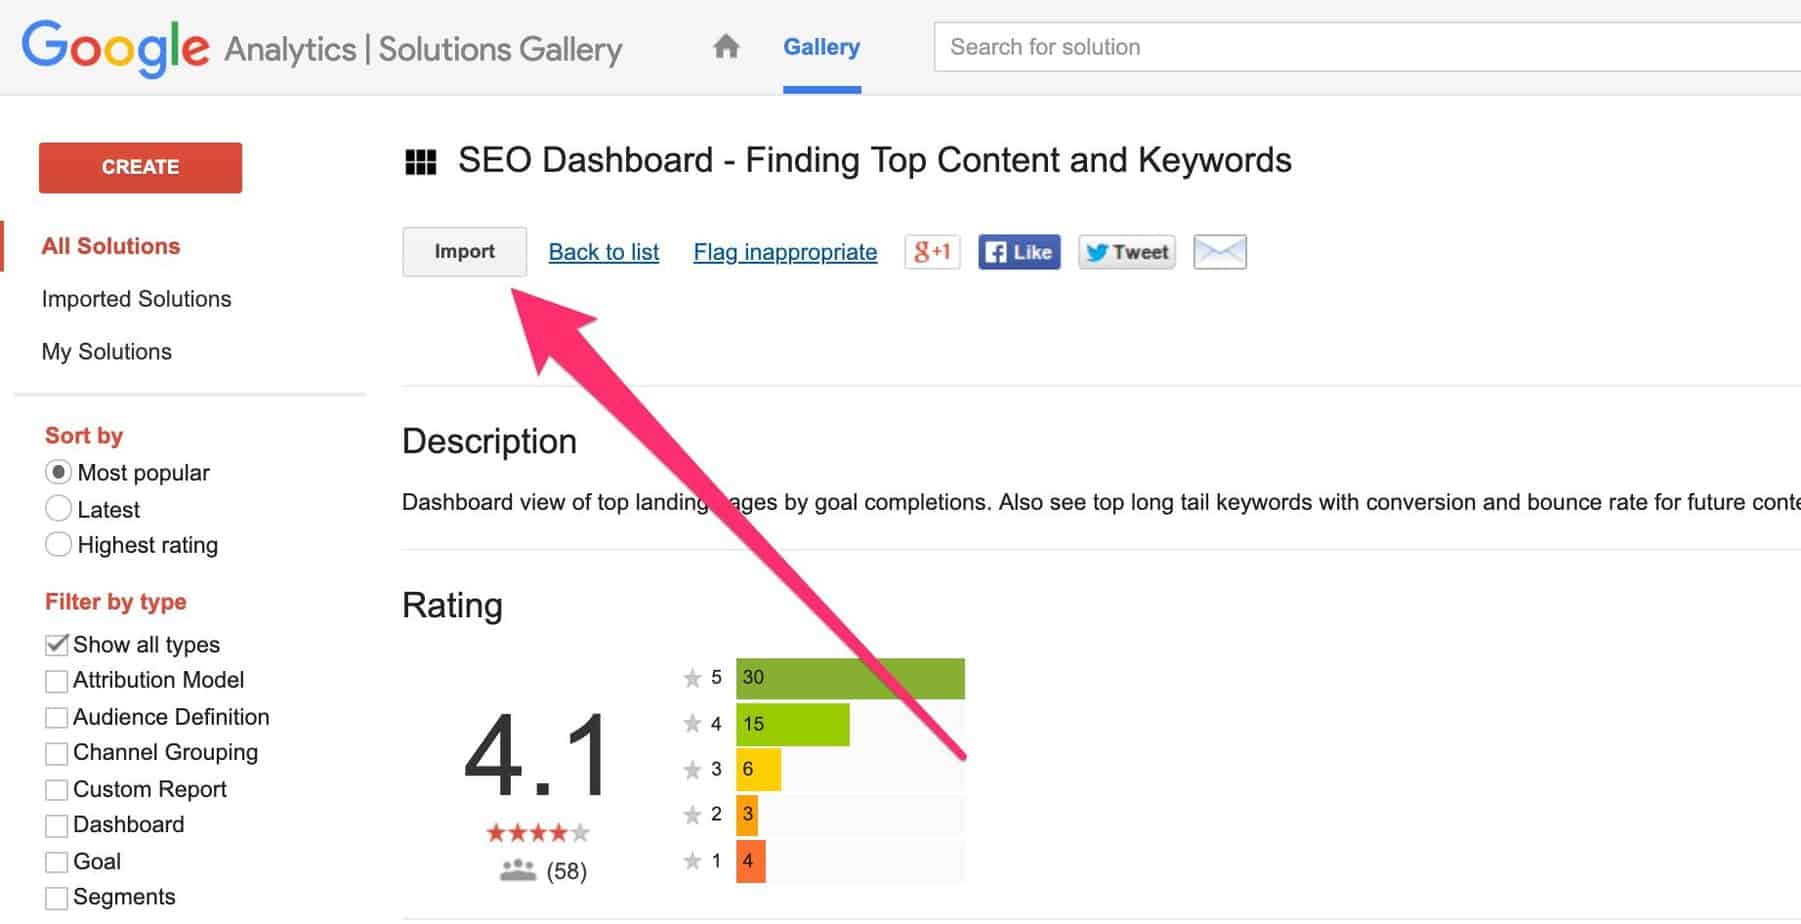
Then click ‘Import’ button on the next screen:
Then select a ‘View’:
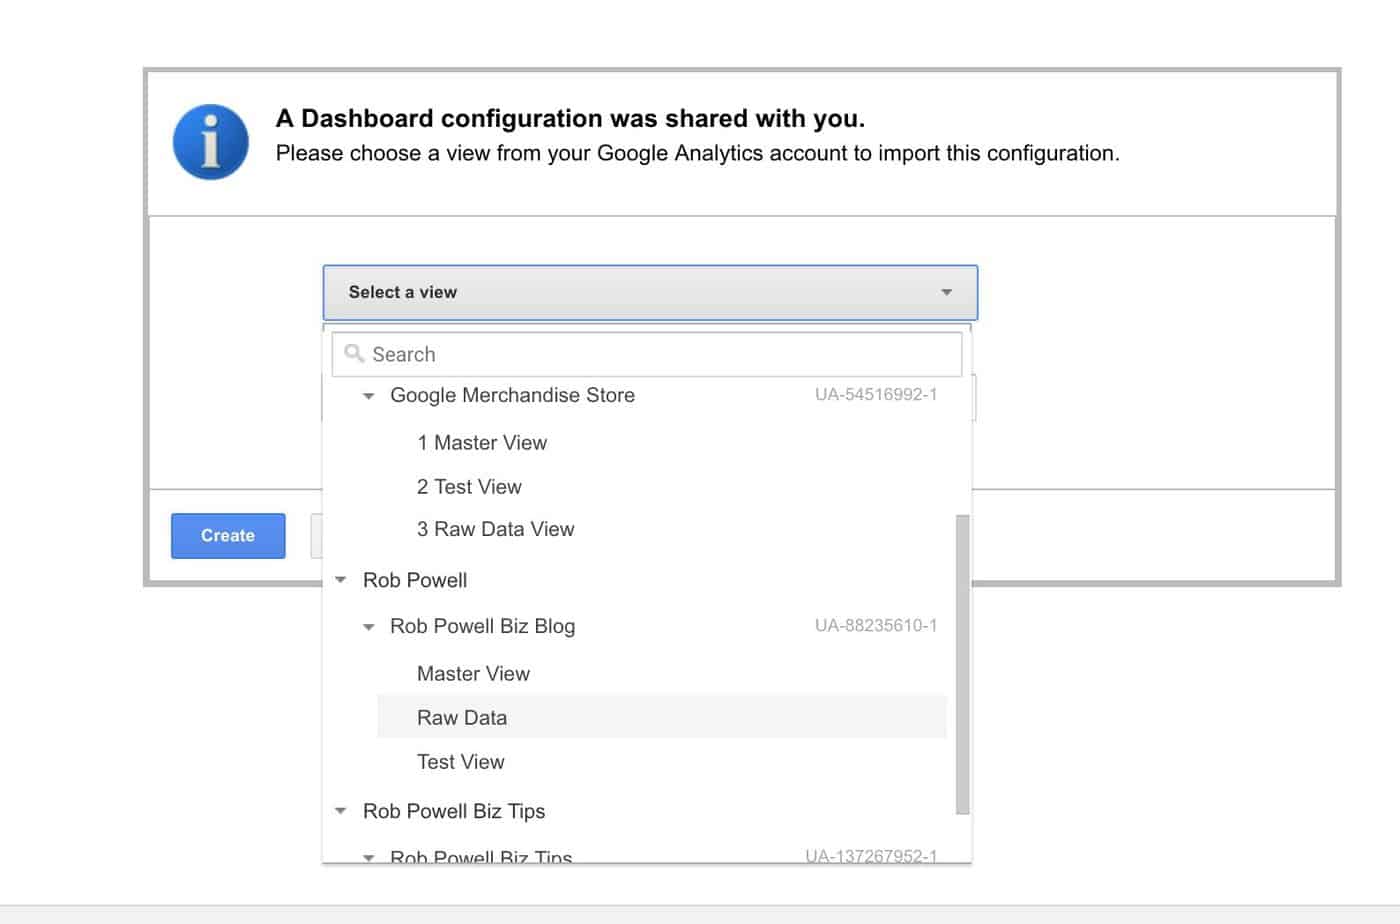
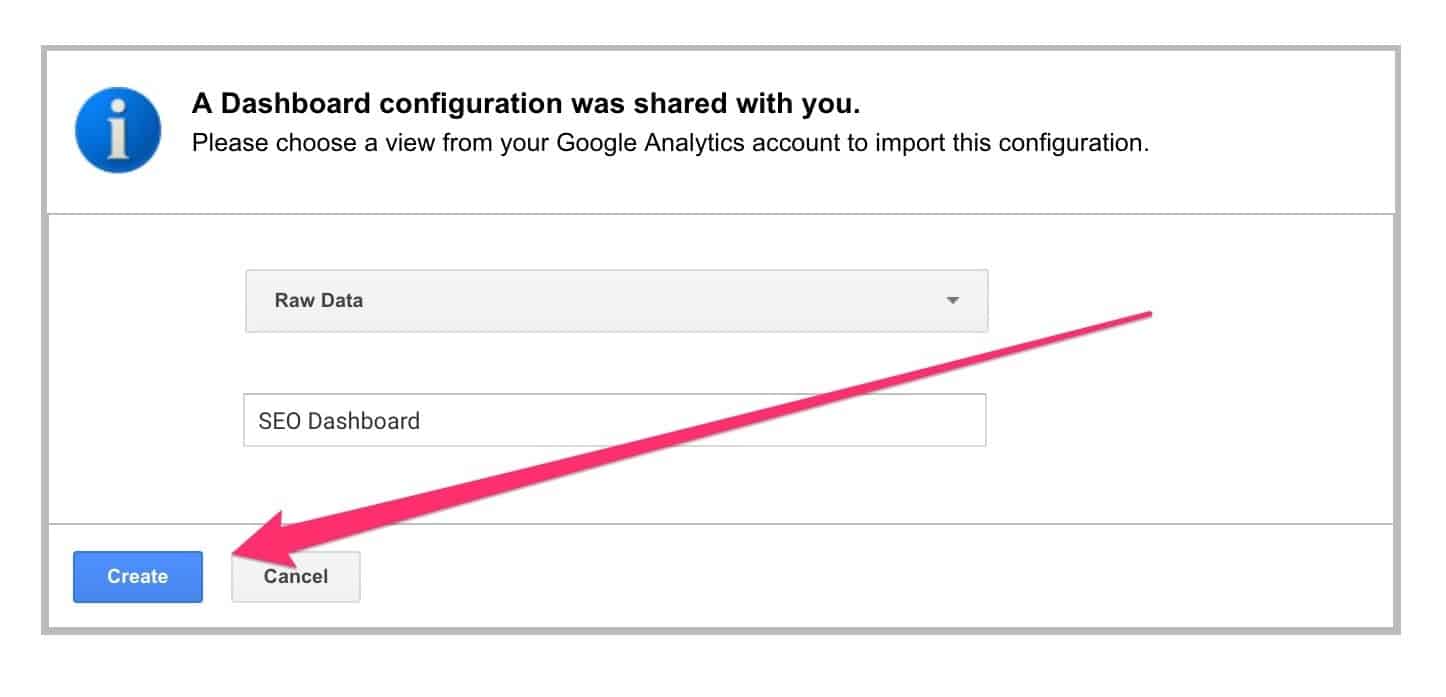
And finally, click ‘Create’:
Here’s an example of a ready-made dashboard designed for bloggers:
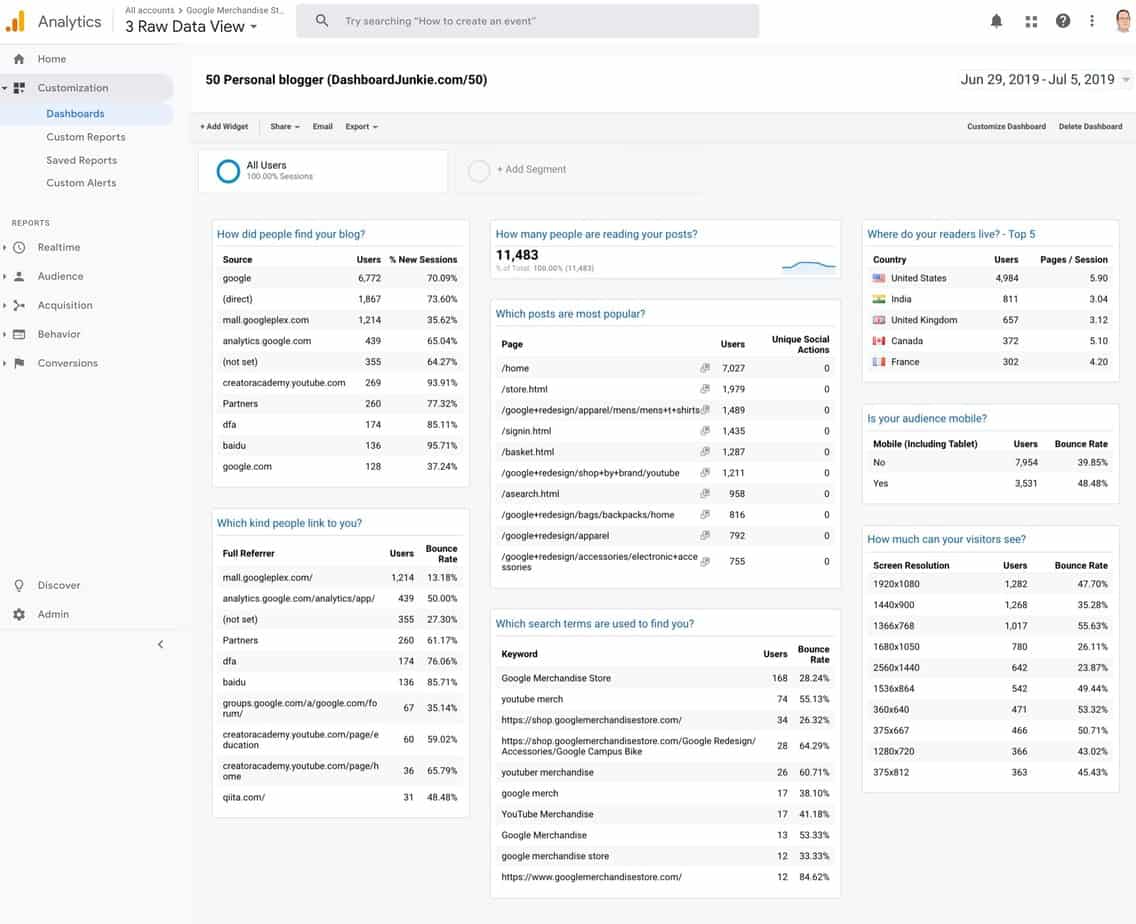
To import this dashboard, log in to your Google Analytics account and then click on this link: ‘Blogger Dashboard’ by Dashboard Junkie.
Alternatively, you can create your own custom dashboard. For instructions on how to create a dashboard from scratch watch this video:
Additional Resources on Google Analytics for Bloggers
I’ve only scratched the surface of how Google Analytics can help you understand which content performs best for your audience.
If you want to go further, here are some useful Google Analytics resources for bloggers:
– Justin Cutroni and Krista Seiden – Google Analytics Academy
This is the best Google Analytics course I’ve seen. And it’s free!
It consists of video tutorials as well as interactive tours of the Google Analytics UI, and periodic assessments.
The course contains three levels:
- Google Analytics for Beginners
- Advanced Google Analytics
- Ecommerce Analytics: From Data to Decisions
– Kristi Hines – The Absolute Beginner’s Guide to Google Analytics
A good introduction to Google Analytics that covers the main topics, including how to install Google Analytics, setting up goals, setting up Site Search, how to view Google Analytics data, and using Custom Reports, Dashboards, and Segments.
– George Freitag – The Blogger Dashboard: Google Analytics for Writers
Shows you how to setup a Google Analytics Dashboard suited to the needs of bloggers.
– Paul Zalewski – Tracking Blog Traffic With Google Analytics
A good (but short) introduction to using Google Analytics to understand your blog’s performance and make informed decisions about content strategy.
– Jayson DeMers – 15 Google Analytics Tricks To Maximize Your Marketing Campaign
Some very useful tips on how to use Google Analytics to optimize both your website and your content marketing strategy. Includes tips on how to:
- Create Goals
- Create Custom Dashboards
- Set Custom Alerts
- Stop Tracking Yourself
- Integrate Google Webmaster Tools
- Segment Your Audience
- Measure Your Speed.
- Check for Browser Differences
- View Behavior Flows
- Track Your Email Campaigns
- Create Custom Campaign URLs
- Analyze Site Searches
– Melissa Culbertson – Five Things To Watch In Your Blog Analytics
A good Introduction to the 5 most important GA metrics for analyzing performance of blog posts:
- Sessions
- Pageviews
- Bounce Rate
- Referrals
- Behavior – All Pages
– Nathan Davidson – How to Analyze Traffic Spikes With Google Analytics
Wondering what caused that sudden spike in traffic? This video shows you how to isolate it and find the cause.
Conclusion
Hidden within your Google Analytics stats is a goldmine of information about your audience and what sort of content they want.
Having this information at your fingertips will help you fine-tune your content strategy and produce the content that your readers engage with.
This is an awesome read. Thanks for sharing this to us!
Thanks, Geline, you’re most welcome, Rob.
I would like to learn e-commerce analytics. What are the best resources (apart from google analytics academy itself) – perhaps an online course ? Are there any specific online groups or associations where I can find my way to hang out and learn from the professionals somewhere?
Hi Kathleen,
This course at Lynda.com teaches marketing analytics, with a focus on setting KPI:
Marketing Analytics: Setting and Measuring KPIs
This is a more general digital marketing course (at Udemy.com) but it does deal specifically with marketing analytics. I can vouch for one of the presenters (Rob Percival) as I have taken some of his other courses and he’s very good:
The Complete Digital Marketing Course – 12 Courses in 1
Hope this helps,
Rob.
hello. google analytics is saying, “there is no data for this view.” my website is https://healthelivinglifestyle.com/. can you help me figure out why no data is showing?
i also meant to say that when i first followed everything in your article it worked perfectly!!! sorry. i’m frustrated now. the article is great, though. i broke my site and had to redo everything. so, when i first did all of what you say in this article, google analytics showed information for my posts/pages. now it shows nothing. but when i click the “send test traffic” button under the Property, then Tracking Code section, the new site does come up. so, i don’t understand why under Real Time, Behavior , Site Content, All Pages, i’m getting “there is no data for this view.” thank you for your help.
Hi Shonda, I’m not sure what the problem is there. Here is a blog post that may help: http://www.ganotes.com/no-data-new-ga-view/ I noted that the owner of that website encourages questions and says she will attempt to answer any question, so it could be worth asking her. All the best, Rob.
Hi Shonda, here’s another article that may be helpful: https://theleverageway.com/blog/google-analytics-not-tracking/. You might also want run a check to see if you have GA code snippets installed correctly: https://smallbusiness.chron.com/check-google-analytics-installed-correctly-49238.html
All the best, Rob.