Here are some e-commerce statistics, organized by ten different criteria, that will help you understand where e-commerce is heading.
E-commerce was already growing rapidly, but the COVID-19 pandemic has given e-commerce an extra boost. By 2040 we’ll be making 95% of purchases online, according to the latest forecasts.
The growth of e-commerce presents huge opportunities for entrepreneurs, both large and small.
A key to succeeding with e-commerce is understanding the trends that are shaping online shopping, online consumer behavior, and the emerging e-commerce markets.
1. Growth in E-commerce (US)
The USA is the world’s largest economy, and it’s also the country that pioneered online shopping, producing e-commerce giants, such as eBay and Amazon. So it’s worth paying close attention to the e-commerce trends in the United States:
- Consumers spent $601.75 billion online with U.S. merchants in 2019, which is up 14.9% in 2018 (Source).
- By 2021, 53.9% of all US retail ecommerce is expected to be generated through mcommerce (Source).
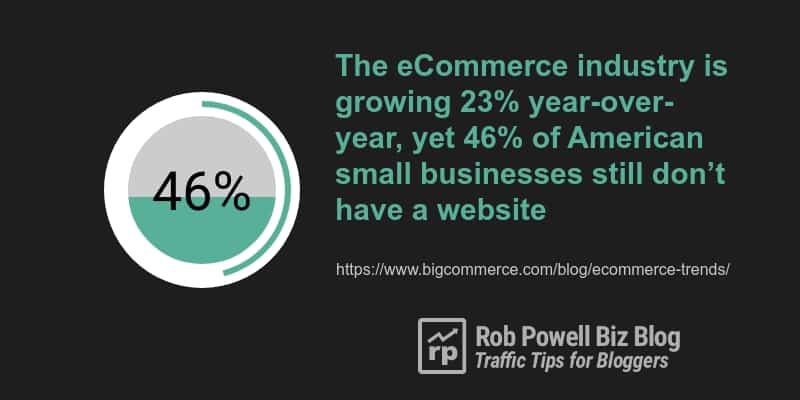
- The eCommerce industry is growing 23% year-over-year, yet 46% of American small businesses still don’t have a website (Source).
- 46% of American businesses still do not have a website (Source).
- Only 8% of total retail sales in the USA derive from online sales (Source).
- 61% of online consumers in the United States have made a purchase based on recommendations from a blog (Source).
- Amazon alone represented more than a third—36.9%—of all U.S. ecommerce sales in 2019 (Source).
- On average, two in five US consumers (41%) receive one to two packages from Amazon per week (Source).
- In 2019, 83.5 percent of the American population purchased goods online (Source).
2. Growth in Ecommerce – Global
While the US had traditionally led the way in ecommerce, as a market it’s being overtaken by emerging in Asia and elsewhere. Here are some global trends in ecommerce:
- In 2019, retail e-commerce sales worldwide amounted to 3.53 trillion US dollars and e-retail revenues are projected to grow to 6.54 trillion US dollars in 2022 (Source).

- By the year 2021, worldwide retail ecommerce sales will reach $4.9 trillion (Source)
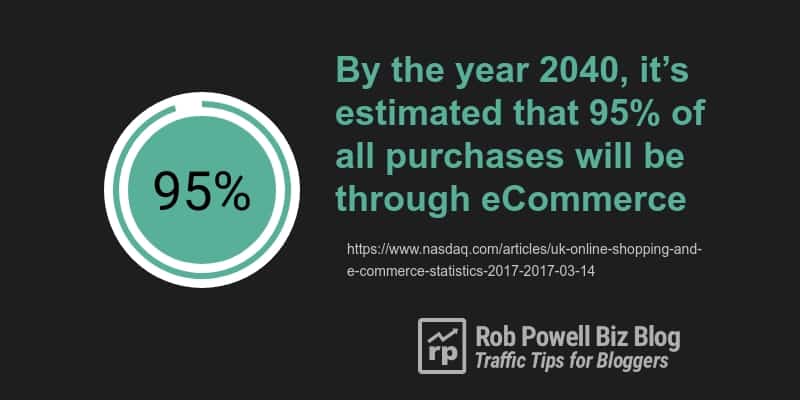
- By the year 2040, it’s estimated that 95% of all purchases will be through eCommerce (Source)
- In 2020, ecommerce sales are expected to account for 15.5 percent of retail sales worldwide (Source)
- It’s estimated that there will be 2.05 billion global digital buyers in 2020 (Source)
- Worldwide, the share of mcommerce in all ecommerce is expected to rise to 72.9% by 2021 (Source)
- Ecommerce retail sales accounted for 14.1% of global retail sales in 2019 (Source)
3. Largest Ecommerce Markets
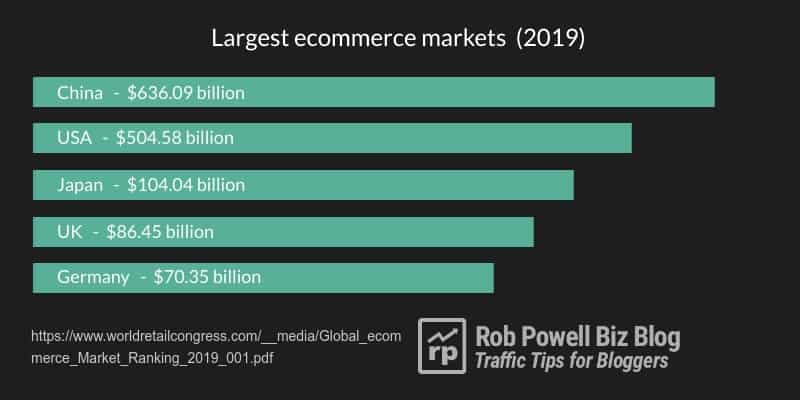
The center of gravity for ecommerce is shifting to the East: two of the top three biggest ecommerce markets are now in Asia:
- China – $636.09 billion
- USA – $504.58 billion
- Japan – $104.04 billion
- UK – $86.45 billion
- Germany – $70.35 billion
(Source)
4. Emerging Ecommerce Markets
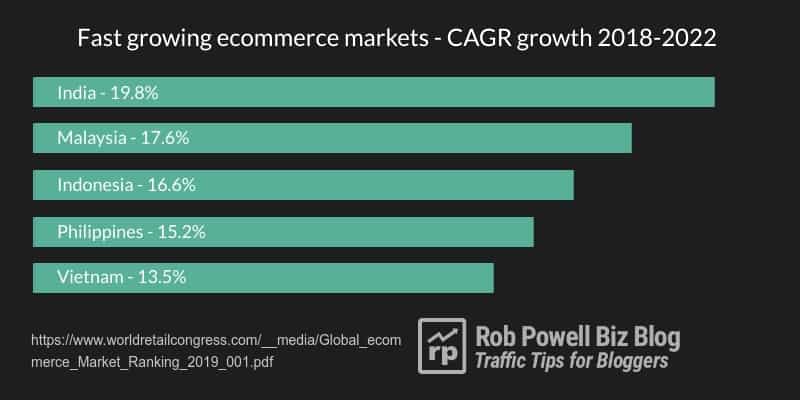
Fast growing e-commerce markets, measured by CAGR growth 2018 – 2022:
- India – 19.8%
- Malaysia – 17.6%
- Indonesia – 16.6%
- Philippines – 15.2%
- Vietnam – 13.5%
(Source)
5. Largest Ecommerce Companies, by Revenue (2019)
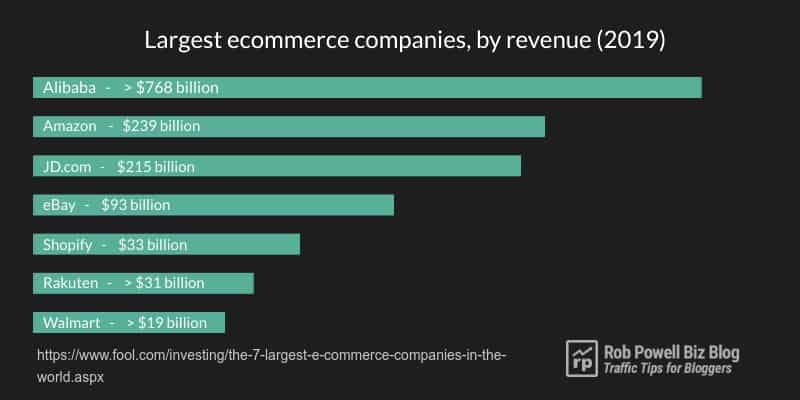
Contrary to what you might think, Amazon is not the largest e-commerce company. Here are the top ranking e-commerce websites based on GMV (Gross Merchandise Value):
- Alibaba – >$768 billion
- Amazon – $239 billion
- JD.com – $215 billion
- eBay – $93 billion
- Shopify – $33 billion
- Rakuten – >$31 billion
- Walmart – >$19 billion
(Source)
6. Number of Online Shoppers (by Country)
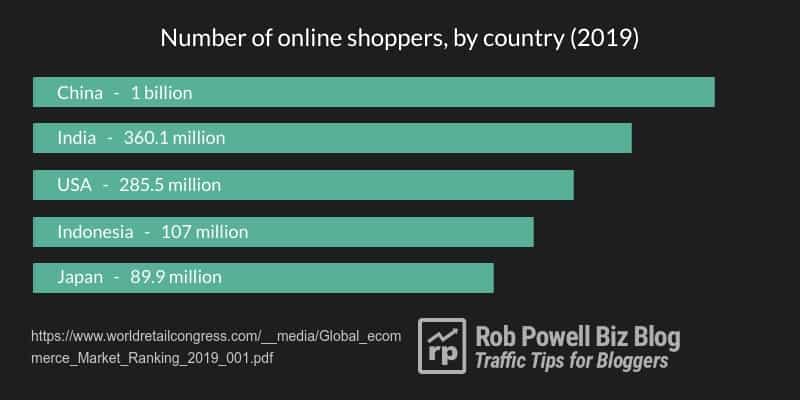
Number of online shoppers, by country:
- China – 1 billion
- India – 360.1 million
- USA – 258.5 million
- Indonesia – 107 million
- Japan – 89.9 million
(Source)
7. Consumer Behavior
- 85 percent of consumers conduct online research before making a purchase online (Source)
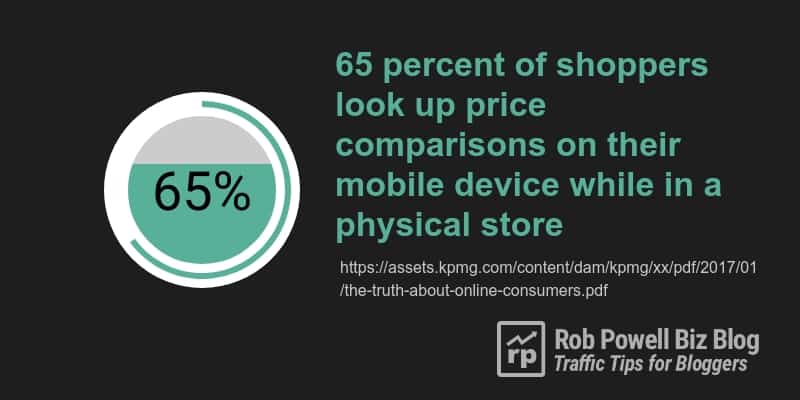
- 65 percent of shoppers look up price comparisons on their mobile device while in a physical store (Source)
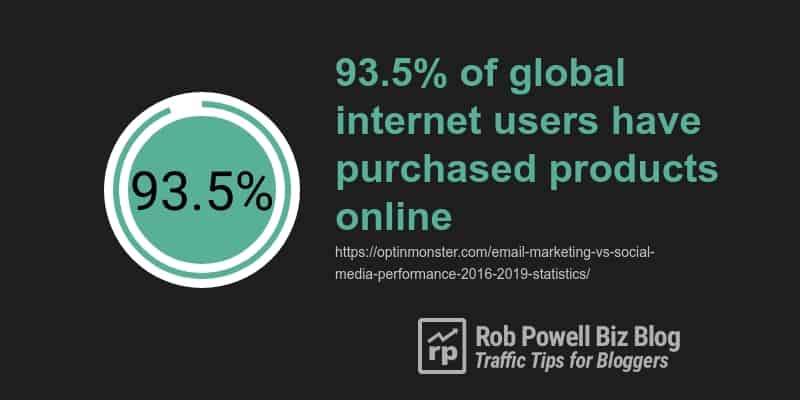
- 93.5% of global internet users have purchased products online (Source)
8. Revenue Per Shopper
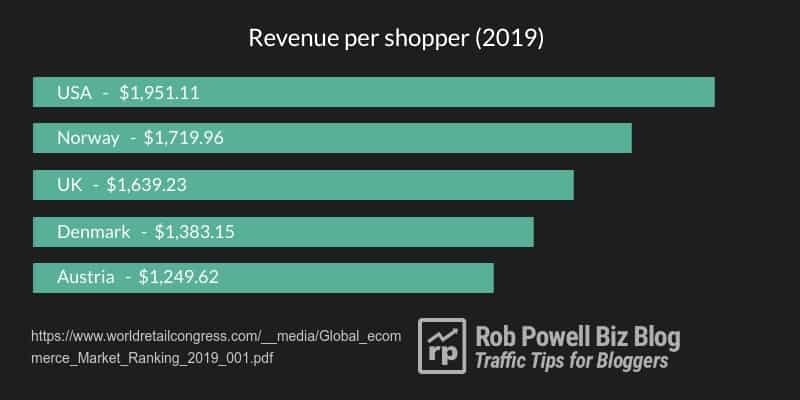
Average annual revenue per shopper (top five countries):
- USA – $1,951.11
- Norway – $1,719.96
- UK – $1,639.23
- Denmark – $1,383.15
- Austria – $1,249.62
(Source)
9. Ecommerce Conversion Rates
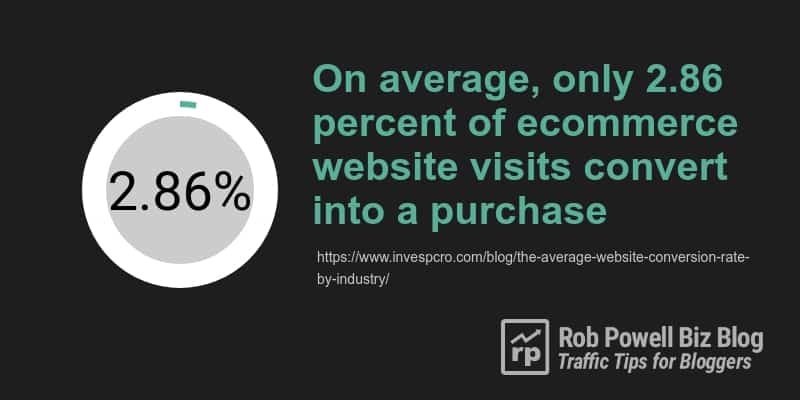
- On average, only 2.86 percent of ecommerce website visits convert into a purchase (Source).
Average conversion rates by device (Q2 – 2019):
- Desktop – 3.9%
- Mobile – 1.82%
- Tablet – 3.49%
(Source)
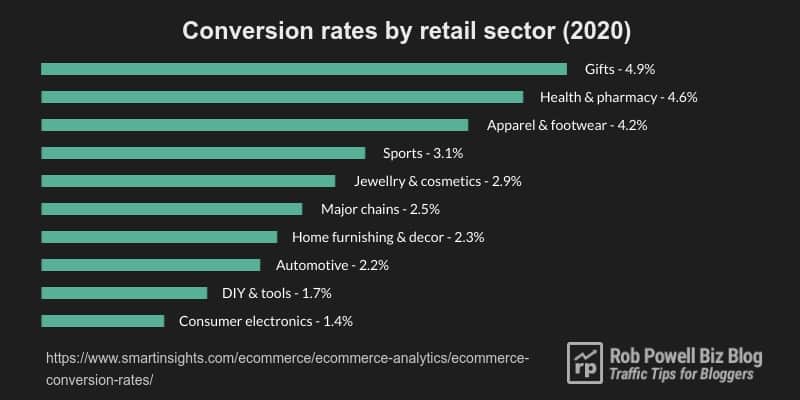
Average conversion rates by retail sector:
- Gifts – 4.9%
- Health & Pharmacy – 4.6%
- Apparel & Footwear – 4.2%
- Sports – 3.1%
- Jewellery & Cosmetics – 2.9%
- Major chains – 2.3%
- Home Furnishing & Decor – 2.3%
- Automotive – 2.2%
- DIY & Tools – 1.7%
- Overall average – 3%
(Source)
10. Cart Abandonment
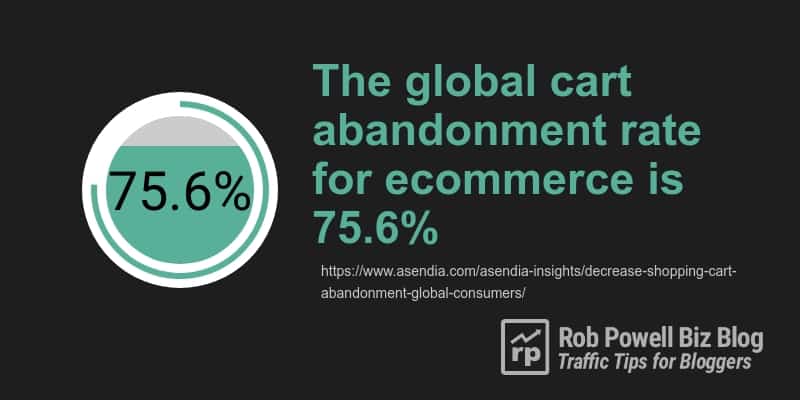
Global average rate of shopping cart abandonment is 75.6% (Source).
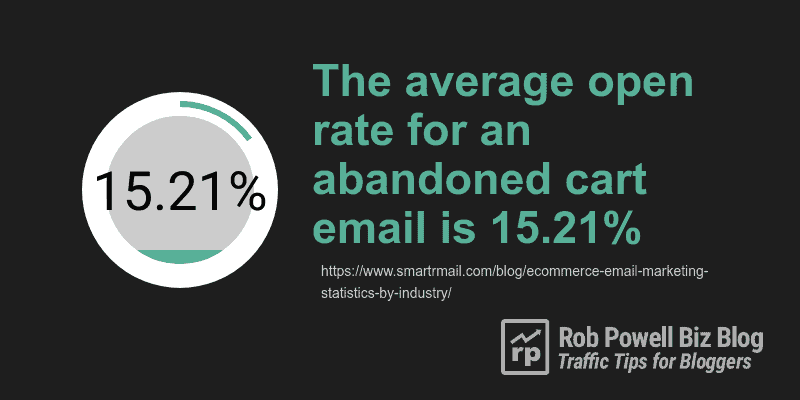
The average open rate for an abandoned cart email is 15.21% (Source).
